Understanding Business Flow Charts
Business flow charts transform complex organizational workflows into clear diagrams, serving as essential tools for mapping steps, decisions, and roles within processes. These visual representations provide a roadmap for operational efficiency, enabling you to communicate procedures with clarity and precision.
Key Takeaways:
- Business flow charts create a universal visual language for understanding complex organizational processes
- Different types of flow charts (process, decision, cross-functional) serve specific organizational needs
- Standardized symbols like rectangles, diamonds, and arrows ensure consistent communication
- Flow charts help identify bottlenecks, redundancies, and opportunities for process improvement
- Implementing flow charts enhances strategic planning and operational transparency
Flow charts convert complicated business operations into straightforward visual guides that anyone can follow. They eliminate confusion by showing exactly how tasks connect and progress through your organization. Modern flowchart software makes creating these diagrams accessible for teams of all sizes.
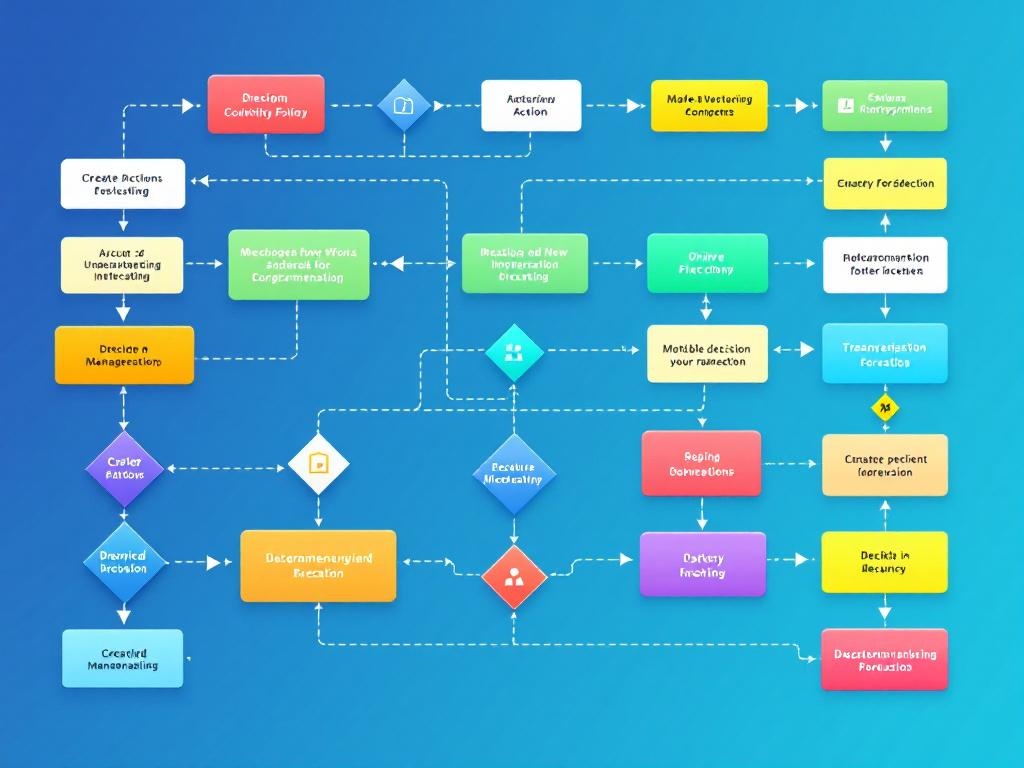
Flow Chart Symbols and Their Meanings
Each symbol in a flow chart has a specific meaning. Rectangles represent actions or tasks. Diamonds indicate decision points where processes branch based on yes/no questions. Arrows connect these elements to show direction and sequence. This standardized approach ensures everyone interprets the diagram correctly.
The Importance of Process Improvement
Process improvement depends on clear visualization. Flow charts expose inefficiencies that might otherwise remain hidden in text-based documentation. They highlight redundant steps, unnecessary approval loops, and potential bottlenecks that slow down operations.
Types of Flow Charts
Different business needs require different flow chart types. Process flow charts map linear sequences of activities. Decision flow charts emphasize choice points and resulting paths. Cross-functional flow charts show how tasks move between departments or team members.
Creating Effective Flow Charts
Creating effective flow charts requires attention to detail. Start with a clear understanding of the current process before attempting to document it. Gather input from everyone involved in the workflow to ensure accuracy. Keep diagrams simple by focusing on critical path activities.
Supporting Strategic Planning
Flow charts support strategic planning by visualizing how proposed changes might impact existing systems. They create a shared reference point for discussing improvements and help teams anticipate downstream effects of process modifications.
Flow Charts in Onboarding and Training
Many organizations use flow charts during onboarding to help new employees understand their role within larger business processes. This visual approach to training accelerates comprehension and reduces errors during the learning curve.
Digital Transformation and Flow Charts
Digital transformation efforts benefit from flow chart documentation of both current and future-state processes. These visual guides bridge the gap between existing systems and planned improvements, helping stakeholders understand the transition path.
“Business flow charts are the universal visual language that transform complex workflows into clear, effective diagrams, enhancing communication and operational efficiency. By providing a structured roadmap, they empower organizations to identify opportunities for improvement and streamline their processes with remarkable clarity.”
Types of Business Flow Charts and Their Applications
Business flow charts serve as visual blueprints that transform complex workflows into clear, understandable diagrams. You’ll find these essential tools indispensable for mapping out steps, decisions, and roles within your organization’s processes. A well-designed business flow chart enhances communication while providing a roadmap for operational efficiency.
When selecting the right business flow chart for your needs, consider these main types and their specific applications:
- Process Flow Diagrams: These chronologically linear charts outline each step in repeated workflows. You’ll benefit from using these when documenting standard operating procedures or onboarding new team members.
- If-Then Flowcharts: These map decision trees and conditional outcomes, making them perfect for risk response strategies and contingency planning. Your teams can quickly determine the next steps based on specific conditions.
- Cross-Functional (Swimlane) Flowcharts: These assign tasks by department, showing interactions between teams. They’re invaluable for project collaboration and clarifying responsibilities across departments.
- Production Flowcharts: Track manufacturing workflows from raw materials to finished products, helping you optimize production lines and resource allocation.
Each business flow chart type uses standardized symbols that create a universal visual language:
- Rectangles: Represent tasks or processes
- Diamonds: Indicate decision points
- Ovals: Mark start/end points
- Arrows: Show directional flow
- Parallelograms: Represent input/output actions
When implementing business flow charts in your organization, follow these best practices:
- Start simple and add details progressively
- Involve key stakeholders in the creation process
- Use consistent symbols and formatting
- Update charts regularly as processes evolve
- Share finalized business flow charts with all relevant team members
The right business flow chart software can dramatically improve your process documentation efforts. Consider these options based on your specific needs:
| Software | Best For | Key Features |
|---|---|---|
| Lucidchart | Large enterprises | Comprehensive templates, real-time collaboration |
| Microsoft Visio | Detailed technical diagrams | Integration with Microsoft ecosystem |
| Miro | Remote teams | Interactive whiteboards, video conferencing |
| Draw.io | Budget-conscious users | Free option, Google Drive integration |
Business flow charts help you identify bottlenecks, redundancies, and opportunities for automation. By implementing these visual tools, you’ll enhance strategic planning and achieve greater operational efficiency across your organization.
Optimizing Business Processes Through Visualization
Your business flow charts serve as more than just documentation—they’re catalysts for improvement. When properly implemented, they help you:
- Identify process gaps and redundancies
- Standardize workflows across departments
- Train new employees more efficiently
- Facilitate smoother handoffs between teams
- Create a foundation for continuous improvement
Expert Insight: To effectively optimize your business processes through flow charts, start by selecting the appropriate type based on your specific needs: use process flow diagrams for documenting standard operating procedures, if-then flowcharts for decision-making scenarios, and cross-functional swimlane charts to clarify roles and responsibilities. Ensure that key stakeholders are involved in the creation process to foster ownership and understanding, and maintain consistency in symbols and formatting to enhance clarity. Regularly update your charts to reflect evolving processes, transforming them into dynamic tools that drive continuous improvement and operational efficiency.
Enhancing Communication and Organizational Alignment
Business flow charts serve as a universal language that transforms complex ideas into simple visual representations. You’ll find these diagrams particularly valuable when trying to create clear communication channels across departments. A well-designed business flow chart breaks down complicated workflows into digestible segments that everyone can understand, regardless of their technical expertise.
When you implement business flow charts in your organization, you create a shared visual understanding of processes that aligns teams and enhances project collaboration at every level. This visual blueprint clearly outlines roles, responsibilities, and information flows, eliminating confusion about who handles specific tasks and when they need completion.
Key Benefits for Organizational Communication
Business flow charts offer several communication advantages that improve your operational effectiveness:
- They create a standardized visual language that crosses departmental boundaries
- They document processes in a format accessible to both technical and non-technical team members
- They support remote and asynchronous collaboration through digital sharing
- They provide clear reference points during training and onboarding
- They establish accountability by mapping responsibilities to specific individuals or departments
Digital business flow chart tools have revolutionized how teams collaborate on process documentation. You can now integrate strategic planning with visual process mapping across distributed teams. This capability proves especially valuable for organizations with remote workers or multiple office locations.
The strategic value of business flow charts extends beyond simple documentation. They function as decision-making tools that facilitate faster problem resolution and project approvals. When stakeholders can visualize the entire process, they make more informed decisions about resource allocation and process improvements.
For maximum effectiveness, update your business flow charts regularly as processes evolve. Outdated business flow charts create confusion rather than clarity. Consider implementing a quarterly review cycle to ensure your diagrams accurately reflect current workflows.
Involving key stakeholders during the creation of business flow charts increases buy-in and ensures accuracy. You should gather input from front-line workers who perform the processes daily, as they often identify nuances that managers might miss. This collaborative approach to business flow chart development strengthens organizational alignment and improves implementation success rates.

Identifying Inefficiencies and Optimizing Operations
A business flow chart serves as your visual roadmap to identify operational weaknesses and streamline your processes. By mapping out each step in your workflow, you’ll quickly spot bottlenecks, redundancies, and activities that don’t add value to your organization. This visualization helps you target specific areas for improvement rather than making broad, ineffective changes.
Studies reveal that 21% of companies save 10% or more through business process optimization strategies that begin with proper flow chart analysis. You can use these visual tools to determine where automation might replace repetitive manual tasks, potentially cutting costs while improving accuracy.
Strategic Benefits of Process Mapping
When you implement business flow charts as part of your management strategy, you’ll experience several key advantages:
- Clarity in decision-making points that may be causing delays
- Identification of redundant steps that waste resources
- Visual evidence of workflow gaps that create miscommunication
- Recognition of process loops that could be streamlined
- Documentation of compliance requirements within processes
A well-constructed business flow chart helps you avoid common project management mistakes by providing clear visual documentation of expected workflows. This transparency is particularly valuable when analyzing cross-departmental processes where handoffs often create confusion.
The practice of mapping your processes through business flow charts also supports effective risk response strategies by allowing you to identify potential failure points before they cause problems.
Using flow charts for process improvement isn’t just about finding problems—it’s about creating standardization. When you document the optimal path for completing tasks, you establish consistent expectations across teams and locations. This standardization becomes particularly valuable when you’re scaling operations or integrating new team members.
The business process automation market is projected to reach $19.6 billion by 2026, driven by companies seeking to optimize operations identified through flow charting exercises. Your business flow chart analysis today sets the foundation for tomorrow’s automation opportunities, ensuring you invest in the right solutions for your specific operational challenges.
Companies that optimize their operations see an average of 15% reduction in costs, ultimately allowing them to invest more in growth and innovation.
forbes.com
Top Flow Chart Software Solutions for 2025
Finding the right business flow chart software can transform how you manage processes and communicate workflows within your organization. The best solutions offer intuitive interfaces while providing powerful features to map complex procedures effectively.
Lucidchart stands out as a cloud-based visualization tool ideal for enterprise-level organizations. You’ll appreciate its extensive template library and real-time collaboration features that allow multiple team members to work simultaneously on the same business flow chart. The drag-and-drop functionality makes creating professional diagrams simple, even for beginners without design experience.
Microsoft Visio continues to dominate the market with its comprehensive diagramming capabilities and seamless integration with other Microsoft products. When planning strategic initiatives, Visio’s advanced data linking features enable you to connect your business flow charts directly to data sources for dynamic visualization.
Miro excels as a collaborative whiteboard platform perfect for distributed teams. The infinite canvas approach gives you the freedom to create expansive business flow charts while facilitating virtual workshops. Teams can use sticky notes, voting, and commenting features to engage in effective project collaboration around process improvements.
Emerging Tools for Specific Business Needs
Draw.io offers a free, open-source alternative with surprising depth of features. You’ll find it integrates well with Google Workspace and various storage platforms, making it ideal for small businesses with budget constraints who still need robust business flow chart capabilities.
For teams focused on continuous improvement, Creately provides specialized business flow chart templates designed for Six Sigma and Lean methodologies. The software helps you conduct thorough root cause analysis through visual process mapping.
SmartDraw delivers industry-specific business flow chart templates for healthcare, manufacturing, and IT operations. The intelligent formatting automatically adjusts your diagrams as you add elements, saving significant time when creating complex business flow charts.
When selecting the right software for your organization, consider these factors:
- Ease of use and learning curve for your team
- Collaboration capabilities for remote or distributed teams
- Integration with existing software systems
- Template availability for your specific industry
- Scalability as your business flow chart needs expand
- Export options for sharing with clients and stakeholders
- Mobile accessibility for on-the-go editing
The right business flow chart software becomes an essential tool in your productivity arsenal, helping teams visualize processes, identify bottlenecks, and implement improvements that drive organizational success.
Organizations that leverage visual collaboration tools like flow chart software experience a 20% increase in team productivity and efficiency.
hbr.org