Dashboard Agile Projects: Transforming Data into Insights
Dashboard Agile Projects provide powerful visual tools that transform complex project data into actionable insights for enhanced decision-making and performance tracking. By consolidating critical metrics into intuitive charts and graphs, these dashboards enable stakeholders across all levels to gain real-time visibility into project progress, team performance, and potential risks.
Key Takeaways
- Dashboard agile projects improve transparency by displaying comprehensive project data in a centralized, easily digestible format.
- Real-time metrics enable faster, data-driven decisions that can reduce project risks by 30-40%.
- Visual performance tracking helps identify bottlenecks and improvement opportunities quickly.
- Custom dashboard configurations support different stakeholder needs, from executive overviews to detailed developer insights.
- Organizations using agile dashboards report 25% faster time-to-market and 20% improvement in team efficiency.
Agile dashboards transform how you monitor and manage projects. These visual interfaces convert raw data into clear, actionable information your team can use immediately. Modern agile metrics displayed through well-designed dashboards cut through complexity to highlight what matters most.
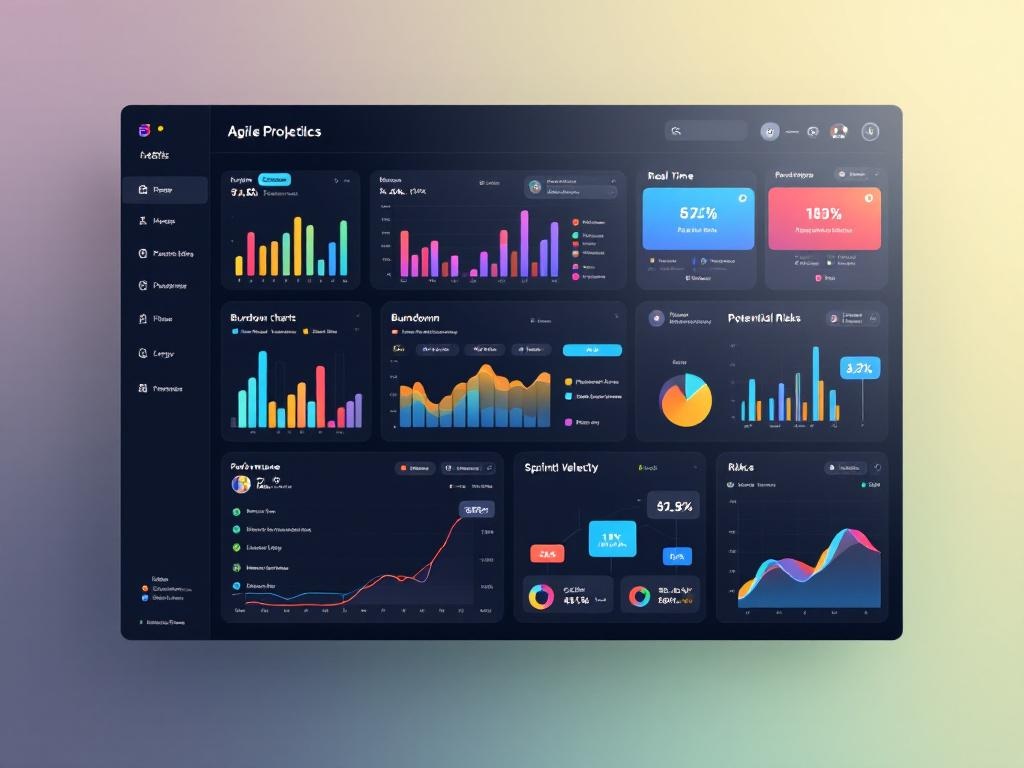
Each dashboard element serves a specific purpose. Burndown charts track remaining work against time, while cumulative flow diagrams show work distribution across different stages. Sprint velocity measurements help you predict future performance based on past results.
The best dashboards adapt to your unique needs. Executive stakeholders need high-level progress indicators and ROI metrics, while team members benefit from detailed task tracking and impediment logs. Custom configurations ensure everyone gets precisely what they need.
Teams implementing dashboard agile projects often experience significant improvements in communication. When everyone sees the same data, conversations become more productive and focused on solutions rather than status updates. This shared understanding creates alignment and improves project governance across departments.
Setting up effective dashboards requires careful consideration of what metrics matter most to your specific goals. Start with basic measurements like story points completed, cycle time, and defect rates before expanding to more specialized metrics. Too much information can overwhelm users, so prioritize clarity over comprehensiveness.
Dashboard technology continues to advance rapidly. Modern tools now incorporate predictive analytics to forecast potential issues before they impact timelines. These capabilities allow you to address problems proactively rather than reactively, significantly reducing project risk.
Remote teams particularly benefit from agile dashboards. With team members distributed across different locations and time zones, these visual tools provide a single source of truth that transcends geographical barriers. Every team member can access current project status regardless of location.
Measuring dashboard effectiveness should focus on both quantitative metrics (faster delivery times, fewer defects) and qualitative factors (improved stakeholder satisfaction, better team collaboration). Regular reviews ensure your dashboards continue to deliver value as your processes and projects evolve.
“Agile project dashboards transform complex data into clear, actionable insights, empowering stakeholders to make swift, informed decisions while enhancing transparency and performance tracking. With real-time metrics and customizable views, these visual tools not only reduce risks and identify bottlenecks but also accelerate time-to-market and boost team efficiency.”
Agile Dashboard: Real-Time Visibility for Enhanced Project Performance
Agile dashboards are visual tools that provide real-time insights into project metrics, team performance, and sprint progress. They consolidate complex data into intuitive charts and graphs that make information easily digestible for all stakeholders in your dashboard agile projects. You’ll find these tools invaluable whether you’re a project manager, Scrum Master, developer, or product owner looking to enhance transparency and accountability.
Core Benefits for Executive Decision-Making
Using dashboard agile projects delivers several key advantages to your organization:
- Improved visibility and transparency: All relevant project data displays clearly in one place, fostering trust and ownership across teams.
- Enhanced decision-making: Real-time metrics enable timely, data-driven decisions, reducing delays and risks by 30-40%.
- Increased productivity: Visualization of performance trends helps you identify bottlenecks and improvement areas quickly.
- Better resource management: Dynamic tracking of resource allocation optimizes project success rates.
- Proactive risk management: Predictive analytics provide early warning indicators to mitigate risks before impacting delivery.
Studies show organizations using agile dashboards report 25% faster time-to-market and 20% improvement in team efficiency. When project communication improves through visual dashboards, team collaboration naturally follows.
Your dashboard agile projects should include these essential metrics and features:
- Sprint metrics: Burndown charts, velocity tracking, and sprint health indicators showing completion rates.
- Workflow efficiency metrics: Cycle time (averaging 1-5 days for high-performing teams), lead time, and throughput.
- Quality indicators: Defect rate, test coverage percentage, and DORA metrics for software delivery performance.
- Portfolio-level insights: Cross-team dependencies, resource allocation, and strategic alignment.
Custom widgets tailored to different stakeholder roles ensure everyone sees relevant information – executives view timelines while developers access task details. Integration capabilities with tools like Jira, GitHub, and Azure DevOps enable automated data syncing and project collaboration across platforms.
To build an effective dashboard agile projects strategy, set clear objectives tied to your organization’s KPIs. This approach helps maintain focus on what matters most while avoiding dashboard clutter. You’ll want to ensure your dashboard supports strategic dashboard elements that align with broader business goals.
Remember to incorporate dashboard agile projects features that support both team-level tactical decisions and executive strategic oversight. This balance ensures maximum value for all stakeholders while maintaining the transparency that’s central to agile methodology.
Organizations using agile dashboards report 25% faster time-to-market and 20% improvement in team efficiency.
forbes.com
Core Benefits for Executive Decision-Making
An effective dashboard for agile projects transforms the way your executive team navigates complex initiatives. With real-time data visualization, you’ll gain immediate insights that traditional reporting methods simply can’t deliver. Dashboard agile projects consolidate critical information into intuitive visual formats, enabling faster decision-making across your organization.
You’ll experience enhanced visibility and transparency when all relevant project metrics are displayed clearly in one central location. This transparency fosters trust among stakeholders and creates a stronger sense of ownership. Properly designed dashboards and scorecards become powerful tools that drive performance throughout your project lifecycle.
Real-time metrics enable timely, data-driven decisions, reducing both delays and risks by 30-40%. When executives can quickly identify emerging issues, they can reallocate resources before problems escalate. Dashboard agile projects provide the essential information needed to make these critical adjustments.
Operational Advantages
Your productivity will increase substantially with visualization of performance trends. These visual indicators identify bottlenecks and highlight improvement areas that might otherwise remain hidden. Dashboard agile projects help teams pinpoint exactly where processes are breaking down.
Dynamic resource tracking optimizes allocation decisions, significantly improving project success rates. You’ll gain insights into which teams are overloaded and which have capacity to take on additional work. Effective capacity planning becomes much more manageable with dashboard visualizations.
Proactive risk management represents another crucial benefit. The predictive analytics within dashboard agile projects provide early warning indicators, allowing you to mitigate risks before they impact delivery schedules. Organizations using agile dashboards report 25% faster time-to-market and 20% improvement in team efficiency.
Dashboard agile projects also strengthen alignment between strategic goals and day-to-day activities. When everyone can see how their work contributes to broader objectives, teams maintain focus on what truly matters. Dashboard agile projects create this connection by visualizing progress toward key milestones and strategic initiatives.
Expert Insight: **Tip: Leverage Real-Time Dashboards for Executive Decision-Making**
Implementing an effective dashboard for agile projects allows your executive team to visualize real-time data, enabling immediate insights that enhance decision-making speed and accuracy. By consolidating key metrics in one intuitive format, stakeholders can identify bottlenecks and allocate resources proactively, mitigating risks and improving project success rates by up to 30-40%. Moreover, this transparency fosters trust and alignment across teams, ensuring that daily operations directly support strategic goals.
Essential Metrics and Features That Drive Results
Your dashboard for agile projects should capture key metrics that enable quick decision-making and performance tracking. A well-designed dashboard transforms complex project data into actionable insights, making it easier to identify trends and address issues before they impact delivery.
Sprint metrics form the foundation of any effective agile dashboard. You’ll want to include burndown charts that visualize remaining work against time, velocity tracking to measure team output consistency, and sprint health indicators showing completion rates. These elements help you understand project management progress at a glance.
Workflow efficiency metrics provide critical insights into your development process. Track cycle time (averaging 1-5 days for high-performing teams), lead time from idea to implementation, and throughput to measure how many work items your team completes. Monitoring these metrics helps you identify bottlenecks and optimize your workflow.
Quality indicators deserve prominent placement on your dashboard agile projects. Include defect rates, test coverage percentages, and DORA metrics (Deployment Frequency, Lead Time for Changes, Mean Time to Restore, Change Failure Rate) to maintain high standards. These metrics help you strengthen project leadership through data-driven quality management.
Customization Features for Maximum Value
Your dashboard should adapt to different stakeholder needs through customizable widgets. Executives might need high-level timelines and budget metrics, while developers require detailed task breakdowns and technical debt indicators. This flexibility ensures dashboard agile projects serve everyone effectively.
Integration capabilities significantly enhance your dashboard’s value. Connect with tools like Jira, GitHub, Azure DevOps, and Slack for automated data syncing. This creates a single source of truth and eliminates manual reporting, saving time and reducing errors in your dashboard agile projects tracking.
Portfolio-level insights help you manage multiple projects simultaneously. Include widgets that display cross-team dependencies, resource allocation, and strategic alignment metrics. These features help you optimize project portfolio management and ensure all initiatives support broader organizational goals.
The most powerful dashboard agile projects include predictive analytics that flag potential issues before they impact delivery. Early warning indicators for scope creep, resource constraints, or quality issues enable proactive management rather than reactive problem-solving.
Companies that use data-driven decision-making are 5 times more likely to make faster decisions than their competitors.
cio.com
Building an Effective Agile Dashboard Strategy
Crafting a powerful dashboard agile projects strategy starts with aligning your metrics to organizational goals. Your dashboard shouldn’t just track activities but should drive meaningful decisions that impact project outcomes. When implemented correctly, your agile dashboard becomes the central nervous system of your project management approach.
To develop an effective dashboard for agile projects, you need to establish clear objectives tied to your organization’s key performance indicators. Each stakeholder requires different information—executives need high-level progress views while developers need detailed task tracking. Dashboard and scorecard designs should reflect these varying needs while maintaining consistency.
Start by selecting metrics that matter. Your dashboard agile projects should include:
- Sprint burndown charts showing remaining work versus time
- Velocity metrics tracking team output consistency
- Cycle time measurements identifying workflow efficiency
- Quality indicators like defect rates and test coverage
- Blocker tracking to identify impediments quickly
- Team capacity utilization showing bandwidth availability
The most effective dashboards integrate data from multiple sources. Consider connecting your data analytics software with your agile tools to create a unified view. This automated approach ensures your metrics remain current without manual updating.
Keep your design intuitive by organizing information hierarchically. Place critical dashboard agile projects metrics prominently and use consistent visual language through colors and shapes. Many teams implement the “three-click rule”—any information should be accessible within three clicks.
Customization for Different Stakeholder Needs
Different team members require different dashboard views. Your dashboard agile projects strategy should accommodate these varied needs:
- For executives: High-level timeline progress, budget status, and strategic alignment
- For product owners: Backlog health, feature completion rates, and customer feedback metrics
- For developers: Task assignments, current sprint status, and technical debt indicators
- For Scrum Masters: Team velocity trends, impediment tracking, and process metrics
Customizable filters let users drill down into specific areas while maintaining a consistent data foundation. This targeted approach helps avoid common project management mistakes by ensuring everyone works from accurate information.
Remember to regularly review and refine your dashboard based on team feedback. Your dashboard agile projects approach should evolve as your team matures and project needs change. Through iterative improvement, your dashboard will become increasingly valuable as a decision-making tool.
Expert Insight: To build an effective Agile dashboard strategy, start by aligning your metrics with organizational goals, ensuring your dashboard drives meaningful decisions. Tailor your dashboard to meet the diverse needs of stakeholders, offering a high-level overview for executives while providing detailed task tracking for developers. Regularly review and refine your dashboard through team feedback, enabling it to evolve and remain a vital decision-making tool that reflects the project’s progress and challenges.