Income Statement Analysis Ratios
Income statement analysis ratios provide critical financial metrics that transform raw financial data into meaningful insights about a company’s profitability, operational efficiency, and overall financial health. These analytical tools enable investors, managers, and analysts to evaluate performance through a systematic assessment of key profitability indicators like gross profit margin, operating profit margin, net profit margin, return on assets, and return on equity.
Key Takeaways
- Income statement analysis ratios help quantify a company’s financial performance across multiple dimensions.
- Profitability ratios reveal operational efficiency and cost management effectiveness.
- Comparative analysis against industry benchmarks provides contextual performance insights.
- Different ratio types (profitability, efficiency, market value) offer comprehensive financial evaluation.
- Technology-enabled platforms now streamline ratio calculation and interpretation.
Financial ratio analysis serves as the foundation for making informed investment decisions in today’s complex market environment. Each ratio tells a specific story about company operations, helping you spot trends that raw numbers might obscure. The interpretation of these metrics requires context – comparing results to previous periods, competitors, and industry standards gives you the full picture.
Many professionals use SEC EDGAR filings as primary sources for conducting thorough financial analysis. Advanced ratio calculations can reveal hidden strengths or weaknesses in a company’s financial structure that casual observation might miss.
For beginners looking to master these concepts, starting with basic profitability ratios provides an accessible entry point before tackling more complex efficiency metrics. Financial analysts regularly combine multiple ratio types to create a comprehensive assessment framework that guides strategic decisions and investment allocations.
“Income statement analysis ratios are the key to unlocking a company’s financial narrative, transforming raw numbers into vital insights on profitability and operational brilliance. By leveraging these powerful metrics, stakeholders can navigate the complex landscape of financial performance with clarity and precision.”
Fundamentals of Income Statement Analysis
Income statement analysis ratios are critical financial metrics derived from income statements that help evaluate a company’s performance. These income statement analysis ratios serve as essential tools for assessing profitability, operational efficiency, and overall financial health. You’ll find these metrics particularly valuable whether you’re an investor making decisions, a manager tracking performance, or an analyst preparing recommendations.
Understanding income statement analysis ratios gives you a structured approach to master strategic planning for your business or investment portfolio. These ratios transform raw financial data into meaningful insights that reveal a company’s true operational performance.
Key Profitability Ratios
Profitability ratios form the cornerstone of income statement analysis ratios, helping you evaluate how effectively a company generates earnings. Here are the essential income statement analysis ratios you should know:
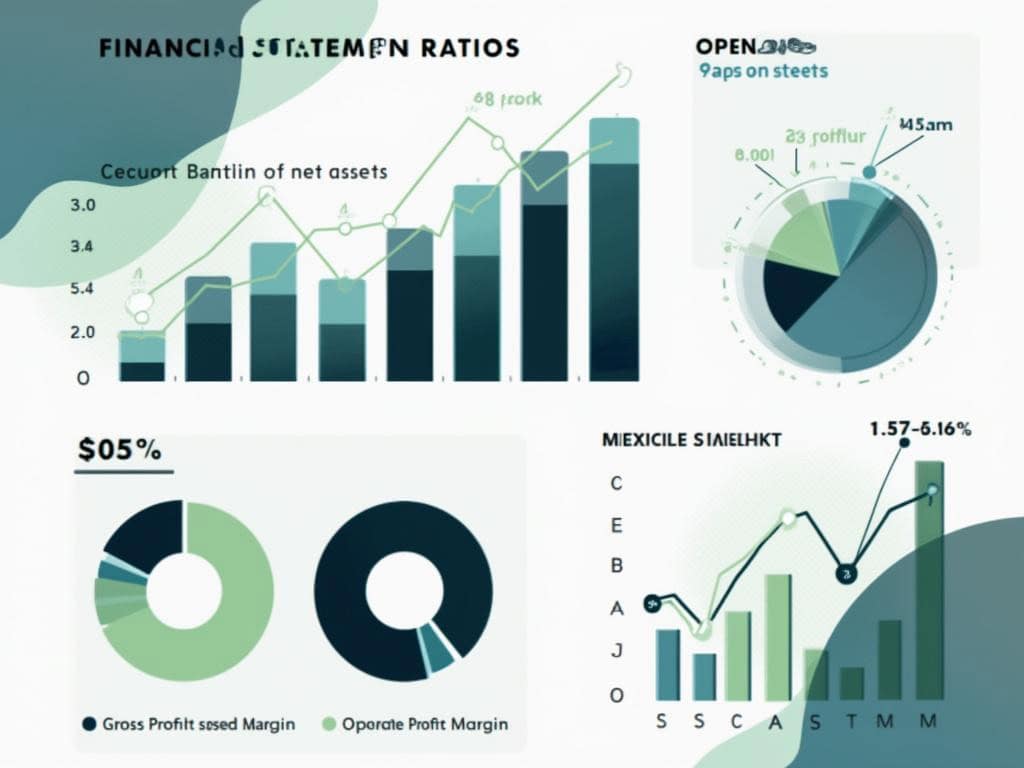
- Gross Profit Margin: Calculated as (Gross Profit / Revenue) × 100, this ratio measures cost management and production efficiency.
- Operating Profit Margin: Determined by (Operating Income / Revenue) × 100, reflecting operational effectiveness before interest and taxes.
- Net Profit Margin: Calculated as (Net Income / Revenue) × 100, providing a comprehensive profitability indicator after all expenses.
- Return on Assets (ROA): Shows how efficiently assets generate earnings, helping you assess management effectiveness.
- Return on Equity (ROE): Measures profitability relative to shareholders’ equity, indicating the return on investment for equity holders.
Using these income statement analysis ratios enables you to perform thorough operational risk management by identifying financial strengths and weaknesses. When analyzing these metrics, you should compare them against industry benchmarks and the company’s historical performance to gain meaningful context.
| Ratio | Formula | What It Tells You |
|---|---|---|
| Gross Profit Margin | (Gross Profit / Revenue) × 100 | Effectiveness of pricing strategy and production cost control |
| Operating Profit Margin | (Operating Income / Revenue) × 100 | Operational efficiency before financing costs |
| Net Profit Margin | (Net Income / Revenue) × 100 | Overall profitability after all expenses |
| Return on Assets | Net Income / Total Assets | Efficiency of asset utilization |
| Return on Equity | Net Income / Shareholders’ Equity | Return generated on shareholders’ investment |
Effective income statement analysis ratios interpretation requires you to consider industry context, economic conditions, and company-specific factors. You’ll make better-informed decisions by understanding the process of strategic decision-making through these financial metrics.

Profitability Ratio Deep Dive
Profitability ratios are essential income statement analysis ratios that help you evaluate how effectively a company generates profit relative to its revenue, assets, and equity. These metrics provide critical insights into a business’s financial performance and operational efficiency.
Key Profitability Metrics
Profitability ratios form the backbone of income statement analysis ratios, offering clear indicators of a company’s ability to generate returns. Here are the fundamental profitability metrics you should analyze:
- Gross Profit Margin: This ratio measures a company’s manufacturing and production efficiency by showing the percentage of revenue that exceeds the cost of goods sold.
- Formula: (Gross Profit / Revenue) × 100
- A higher gross profit margin indicates better cost management in production processes.
- Operating Profit Margin: This income statement analysis ratio reveals how efficiently a company manages its operations before accounting for interest and taxes.
- Formula: (Operating Income / Revenue) × 100
- This metric helps you identify process optimization methods by highlighting operational effectiveness.
- Net Profit Margin: The most comprehensive profitability indicator showing what percentage of revenue becomes actual profit after all expenses.
- Formula: (Net Income / Revenue) × 100
- This ratio helps you make informed strategic planning decisions based on bottom-line performance.
- Return on Assets (ROA): Measures how efficiently a company uses its assets to generate profits.
- Formula: (Net Income / Total Assets) × 100
- Higher ROA values indicate more effective asset utilization.
- Return on Equity (ROE): Shows how effectively a company uses shareholder investments to create profits.
- Formula: (Net Income / Shareholders’ Equity) × 100
- This income statement analysis ratio is particularly valuable for investor decision-making.
The following table summarizes these key income statement analysis ratios for quick reference:
| Ratio | Formula | What It Measures |
|---|---|---|
| Gross Profit Margin | (Gross Profit / Revenue) × 100 | Production efficiency |
| Operating Profit Margin | (Operating Income / Revenue) × 100 | Operational effectiveness |
| Net Profit Margin | (Net Income / Revenue) × 100 | Overall profitability |
| Return on Assets | (Net Income / Total Assets) × 100 | Asset utilization efficiency |
| Return on Equity | (Net Income / Shareholders’ Equity) × 100 | Investment return efficiency |
When analyzing these income statement analysis ratios, you should always compare them against industry benchmarks and the company’s historical performance. This approach helps you identify trends and anomalies that might require further investigation or indicate areas for improvement.
Expert Insight: To effectively evaluate a company’s financial health, delve into profitability ratios by comparing key metrics like Gross Profit Margin, Operating Profit Margin, and Net Profit Margin against industry benchmarks and historical performance. This comparative analysis not only highlights efficiency and operational strengths but also uncovers potential areas for improvement. Regularly analyzing Return on Assets (ROA) and Return on Equity (ROE) can further guide informed decision-making and strategic planning based on comprehensive profitability insights.
Performance Measurement Techniques
You’ll gain critical financial insights by mastering income statement analysis ratios for performance measurement. These ratios help you evaluate a company’s ability to manage debt, utilize assets efficiently, and determine market value—all essential for comprehensive financial assessment.
The interest coverage ratio stands as a fundamental income statement analysis ratio that measures a company’s ability to handle debt obligations. You can calculate this by dividing earnings before interest and taxes (EBIT) by interest expense. A higher ratio indicates stronger debt payment capability, which reassures creditors and investors about the company’s financial stability.
Market and Efficiency Evaluation
Market value ratios connect income statement data with external market valuations, providing crucial income statement analysis ratios for investors. The following ratios help you understand how the market perceives a company’s financial performance:
- Price/Earnings (P/E) Ratio: Compares stock price to earnings per share, indicating market expectations
- Dividend Yield: Shows annual dividend income relative to share price
- Price to Sales Ratio: Evaluates company valuation against revenue generation
Efficiency ratios represent another important category of income statement analysis ratios that measure how effectively a company utilizes its assets. You can track these metrics to identify operational improvements:
- Asset Turnover: Reveals how efficiently assets generate revenue
- Inventory Turnover: Shows how quickly inventory is sold
- Receivables Turnover: Indicates effectiveness of credit policies and collection practices
When conducting income statement analysis ratios review, you should implement various analytical approaches. Horizontal analysis examines financial trends across multiple periods, while vertical analysis converts data to common-size percentages for easier proportional comparison. You can also perform cross-sectional analysis to compare performance against industry peers, providing context for your ratio results.
Technology has transformed how you can apply income statement analysis ratios. AI-powered platforms like Daloopa and Evolution AI offer automated calculations and reporting capabilities. These tools reduce manual work while delivering strategic insights through income statement analysis ratios that help with strategic decision-making processes.
By consistently leveraging these income statement analysis ratios, you’ll identify operational strengths and weaknesses, benchmark against industry standards, and make informed investment decisions that drive business success.
Companies that effectively use performance measurement tools can increase their productivity by 10% to 15%.
forbes.com
Analytical Approaches
Analyzing your company’s income statement reveals crucial performance insights. Income statement analysis ratios provide a structured methodology to evaluate financial health and make informed decisions. You’ll gain a deeper understanding of your firm’s profitability and operational efficiency through systematic analytical approaches.
When conducting income statement analysis ratios evaluation, you can apply several methodologies to extract meaningful insights:
Horizontal Analysis
Tracks your financial performance across time periods, revealing trends and patterns in income statement analysis ratios. This approach helps you identify growth trajectories and potential financial issues by comparing ratios like net profit margin or gross profit percentage year-over-year. For example, declining profit margins over consecutive quarters may signal increasing cost pressures or pricing challenges.
Vertical Analysis
Converts each income statement line to a percentage of total revenue, making income statement analysis ratios more comparable. This method transforms your income statement into a common-size format where every item represents a proportion of sales. You’ll quickly spot when costs are consuming an increasing share of revenue or when income statement analysis ratios deviate from historical norms.
Cross-sectional Analysis
Compares your income statement analysis ratios against industry peers. This competitive benchmarking helps you understand your relative market position and identify performance gaps within your sector. For instance, if your operating margin is 15% while industry leaders maintain 20%, this reveals potential for operational improvement.
Combining these analytical approaches creates a comprehensive framework for evaluating income statement analysis ratios. You’ll benefit from implementing these techniques through:
- Identification of operational inefficiencies through income statement analysis ratios
- Detection of emerging financial trends before they impact performance
- Creation of realistic performance targets based on industry standards
- Development of data-driven strategic planning initiatives
Each approach offers unique perspectives on your income statement analysis ratios. By integrating horizontal, vertical, and cross-sectional analyses, you’ll develop a multi-dimensional understanding of your financial performance that supports better decision-making and helps identify areas for improvement.
Expert Insight: To enhance your financial decision-making, integrate horizontal, vertical, and cross-sectional analyses of your company’s income statement. Horizontal analysis allows for trend observation over time, helping identify growth trajectories and potential issues, while vertical analysis facilitates comparison by converting line items into a percentage of total revenue for quick insights. Finally, cross-sectional analysis benchmarks your ratios against industry peers, revealing performance gaps and operational improvement opportunities essential for strategic planning.
Technology-Enabled Analysis
The evolution of financial analysis has been revolutionized by technology, making income statement analysis ratios more accessible and actionable than ever before. AI-powered financial analysis tools have transformed how you extract value from financial data, allowing for deeper insights with less manual effort.
Leading Platforms for Income Statement Analysis Ratios
Modern financial analysis platforms have streamlined the process of calculating and interpreting income statement analysis ratios. These tools offer significant advantages for your financial assessment workflow:
- Daloopa: Automates financial data extraction and income statement analysis ratios calculation, reducing manual input errors
- Evolution AI: Provides predictive analytics based on historical income statement analysis ratios
- Excel-based tools: Offer customizable templates for calculating profitability ratios, interest coverage ratios, and efficiency metrics
These platforms deliver substantial benefits when analyzing income statement analysis ratios:
- Enhanced accuracy through automated calculation of income statement analysis ratios
- Reduced manual data entry with intelligent data extraction
- Real-time visualization of income statement analysis ratios trends
- Customizable dashboards for tracking key profitability metrics
- Competitive benchmarking of income statement analysis ratios against industry standards
When implementing database analytics for income statement analysis ratios, you’ll experience dramatic efficiency improvements. The right software can reduce analysis time by up to 80% while simultaneously improving accuracy in ratio calculations. This allows your team to focus on strategic interpretation rather than data compilation.
Strategic decision-making benefits significantly from technology-enabled income statement analysis ratios. By implementing strategic dashboard systems, you can continuously monitor profitability ratios like gross profit margin, operating profit margin, and net profit margin alongside other critical metrics.
Technology now enables you to conduct more sophisticated ratio analysis, including:
- Automated trend analysis showing income statement analysis ratios over multiple periods
- Comparative analysis between your ratios and industry benchmarks
- What-if scenario modeling to predict how strategic changes might impact your future ratios
- Visualization tools that translate complex income statement analysis ratios into actionable insights
The integration of income statement analysis ratios into your financial management system creates a powerful foundation for strategic planning. By leveraging technology, you transform raw financial data into meaningful insights that drive better business decisions and improved financial performance.
Strategic Application and Business Impact
Income statement analysis ratios deliver powerful insights that drive strategic business decisions. These income statement analysis ratios transform raw financial data into actionable intelligence, helping you identify operational strengths and weaknesses that might otherwise remain hidden. By systematically applying income statement analysis ratios, you’ll gain a competitive edge through data-driven decision-making.
Leveraging Ratios for Strategic Decisions
Income statement analysis ratios serve as critical tools for evaluating your company’s financial health and guiding strategic planning. When properly applied, these income statement analysis ratios can:
- Pinpoint operational inefficiencies that reduce profitability
- Highlight successful business segments deserving additional investment
- Identify underperforming divisions requiring intervention
- Track progress toward financial goals and targets
- Support evidence-based budgeting and resource allocation
The strategic implementation of income statement analysis ratios varies by organizational need. For example, declining gross profit margins might prompt you to optimize production processes or renegotiate supplier contracts. Similarly, weakening net profit margins could trigger cost-cutting initiatives or pricing strategy adjustments.
Effective benchmarking against industry standards represents another vital application of income statement analysis ratios. This comparison helps you:
- Establish realistic performance targets
- Identify competitive advantages and disadvantages
- Recognize industry-specific challenges and opportunities
- Determine reasonable growth expectations
Your strategic planning becomes more robust when incorporating income statement analysis ratios into strategic planning sessions. These metrics inform critical decisions about market expansion, product development, capital allocation, and operational improvements.
The table below illustrates how specific income statement analysis ratios inform different strategic decisions:
| Ratio | Strategic Application |
|---|---|
| Gross Profit Margin | Pricing strategy, production efficiency initiatives |
| Operating Profit Margin | Cost control measures, operational restructuring |
| Net Profit Margin | Overall business model evaluation, dividend policy |
| Return on Assets | Capital expenditure decisions, asset utilization plans |
| Return on Equity | Financing strategies, shareholder value enhancement |
By developing a regular monitoring cadence for these income statement analysis ratios, you create an early warning system for potential issues. This proactive approach allows for course corrections before problems escalate, supporting continuous improvement across your organization.