Lean Six Sigma Excel: A Data-Driven Approach to Process Improvement
Lean Six Sigma Excel combines methodologies that create a data-driven approach for process improvement. This approach transforms how organizations address quality issues, cut waste, and boost efficiency. Excel’s analytical tools and statistical functions allow professionals to implement advanced process improvement strategies across industries. These techniques become accessible to teams regardless of their expertise level.
Key Takeaways
- Lean Six Sigma Excel provides accessible tools for data collection, analysis, and visualization of process improvement initiatives.
- Excel supports both DMAIC and DMADV frameworks with templates and functions for statistical analysis.
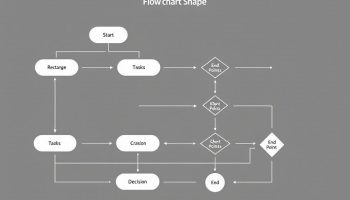
- Critical templates like Project Charter, SIPOC Diagram, and Fishbone Diagram enable comprehensive process mapping.
- Built-in Excel statistical functions help calculate key metrics like process capability indices and defects per million opportunities.
- The methodology transforms raw data into actionable insights, driving a data-driven culture of continuous improvement.
Excel’s data analysis capabilities make it an ideal platform for Lean Six Sigma implementation. You’ll find that combining these methodologies creates a practical framework for identifying process issues. The integration of these approaches allows you to track improvements with concrete metrics rather than assumptions.
Quality professionals appreciate how Six Sigma techniques in Excel eliminate the need for specialized software in many cases. This accessibility democratizes process improvement, allowing smaller organizations to adopt practices previously available only to larger corporations with substantial resources.
The visualization tools in Excel help you communicate complex data findings to stakeholders across your organization. When you present clear, visual evidence of process inefficiencies through Lean Six Sigma templates, you’ll gain faster buy-in for improvement initiatives from leadership teams.
“Lean Six Sigma Excel transforms the intricate world of process improvement into an accessible, data-driven journey, empowering teams to tackle quality issues and enhance efficiency with confidence. By harnessing Excel’s powerful tools and templates, organizations can turn raw data into actionable insights, fostering a culture of continuous improvement across all levels.”
Overview of Lean Six Sigma Methodology and Excel’s Critical Role in Process Improvement
Lean Six Sigma combines two powerful methodologies to create a data-driven approach to process improvement. The lean six sigma excel combination has revolutionized how organizations tackle quality issues, reduce waste, and increase efficiency. You’ll find Excel serves as the backbone for implementing these methodologies, providing accessible tools for data collection, analysis, and visualization.
The DMAIC framework (Define, Measure, Analyze, Improve, Control) structures problem-solving efforts in existing processes, while DMADV (Define, Measure, Analyze, Design, Verify) guides the development of new processes or products. Excel supports both frameworks with templates and functions that make complex statistical analysis accessible to professionals at all levels.
Essential Excel Templates for Process Improvement
Your process improvement initiatives can benefit from these critical lean six sigma excel templates:
- Project Charter: Defines project scope, objectives, and stakeholders
- SIPOC Diagram: Maps suppliers, inputs, process, outputs, and customers
- Fishbone Diagram: Identifies potential causes of defects
- 5 Whys Analysis: Drills down to root causes
- Pareto Chart: Highlights the vital few causes from the trivial many
- Control Plan: Maintains process improvements over time
These templates have proven valuable across industries. In manufacturing, lean six sigma excel tools help monitor production line efficiency. Healthcare organizations use them to improve patient care processes. Financial institutions implement them to reduce transaction errors and processing times.
Excel’s data visualization capabilities transform complex process data into actionable insights. You can create sophisticated charts that reveal patterns and trends, making it easier to conduct thorough root cause analysis. The built-in statistical functions help calculate key metrics like process capability indices (Cpk) and defects per million opportunities (DPMO).
By leveraging these lean six sigma excel tools, you’ll establish a data-driven culture where decisions are based on facts rather than opinions. Excel’s accessibility makes these powerful methodologies available to everyone in your organization, not just statistical experts or dedicated quality professionals.
The combination of lean principles (focusing on eliminating waste) and Six Sigma methodologies (reducing variation) creates a comprehensive approach to process excellence. With Excel as your primary tool, you can implement sophisticated improvement strategies without investing in expensive specialized software.

Essential Excel Templates for Process Improvement
Excel serves as a cornerstone tool for implementing lean six sigma excel methodologies in your organization. You’ll find these templates invaluable for transforming raw data into actionable insights that drive process improvement initiatives.
The most critical lean six sigma excel templates you should incorporate into your toolkit include:
- Project Charter – Documents project scope, objectives, and team roles
- SIPOC Diagram – Maps suppliers, inputs, process, outputs, and customers
- Fishbone Diagram – Visualizes potential causes of problems
- 5 Whys Analysis – Drills down to root causes through sequential questioning
- Pareto Chart – Identifies the vital few issues causing the majority of problems
- Control Plan – Maintains process improvements over time
Each template offers unique advantages when applied to process mapping and data visualization tasks. For example, in manufacturing, you can use control charts to monitor production defects. Healthcare organizations might leverage lean six sigma excel templates for patient flow analysis, while financial institutions can apply these tools to optimize transaction processing.
Industry-Specific Applications
| Industry | Primary Application | Key Template |
|---|---|---|
| Manufacturing | Defect reduction | Control charts |
| Healthcare | Patient wait time | Process mapping |
| Finance | Transaction errors | Pareto analysis |
| Retail | Inventory management | 5S audit forms |
| IT Services | Support ticket resolution | Root cause analysis |
When implementing these templates, you’ll need to customize process improvement tools to match your specific operational challenges. The power of lean six sigma excel lies in its flexibility to handle data from various sources while maintaining statistical rigor.
Many organizations find that creating a central repository of these templates facilitates wider adoption. This approach encourages cross-departmental collaboration and ensures consistent application of lean six sigma excel methodologies throughout your operations.
For complex processes, consider value stream mapping software that integrates with Excel for more sophisticated analysis. These integrated solutions help identify bottlenecks more efficiently while maintaining the familiar Excel interface your team already knows.
By systematically applying these lean six sigma excel templates, you’ll develop a data-driven approach to process improvement that reveals hidden inefficiencies and provides clear pathways to operational excellence.
Organizations that implement Lean Six Sigma see a 60% reduction in defects, leading to increased customer satisfaction and reduced costs.
hbr.org
Statistical Rigor and Quality Measurement
Six Sigma’s power lies in its statistical approach to quality improvement, and Excel provides the perfect platform for implementing these tools. You’ll find lean six sigma excel applications essential for quantifying process performance and driving data-based decisions in your improvement initiatives.
Excel offers built-in functions that calculate critical Six Sigma metrics, including Defects Per Million Opportunities (DPMO). This key measurement helps you quantify how often your process fails to meet specifications. The ultimate Six Sigma goal is reaching 3.4 defects per million opportunities – a standard of excellence that represents near-perfect quality.
Process capability indices like Cp, Cpk, Pp, and Ppk can be easily calculated using lean six sigma excel templates. These indices tell you how well your process meets specifications and whether it’s centered properly between upper and lower control limits. You can use Excel’s built-in statistical functions to calculate these metrics without complex programming:
- AVERAGE() and STDEV.S() functions form the foundation for capability calculations
- NORM.S.DIST() helps determine how much of your process falls within specification limits
- Custom formulas combine these functions to generate comprehensive capability reports
Control Chart Analysis in Excel
Control charts represent one of the most powerful lean six sigma excel tools for monitoring process stability. You can create these visualizations directly in Excel to track process variation over time and identify special cause variation. The statistical control charts help you distinguish between:
- Common cause variation (natural process fluctuation)
- Special cause variation (assignable, abnormal variation requiring investigation)
When implementing control charts in Excel, you’ll typically include:
| Chart Type | Best Used For | Key Excel Features |
|---|---|---|
| X-bar & R | Variable data, subgroups | Line charts, error bars |
| Individual & MR | Continuous process data | Scatter plots, trendlines |
| p-chart | Proportion defective | Binary calculations, AVERAGE() |
| c-chart | Count of defects | COUNT(), conditional formatting |
The beauty of using lean six sigma excel for statistical analysis is that you can easily connect your quality measurements to root cause analysis tools. This creates a comprehensive quality system that not only identifies problems but helps solve them systematically.
By combining Excel’s statistical capabilities with Six Sigma’s methodology, you’ll transform raw data into actionable quality insights. This statistical rigor ensures your improvement efforts target the true causes of variation rather than symptoms, maximizing your return on improvement investments.
Organizations that leverage data-driven decision-making are 5-6 times more likely to achieve better performance than their competitors.
bloomberg.com
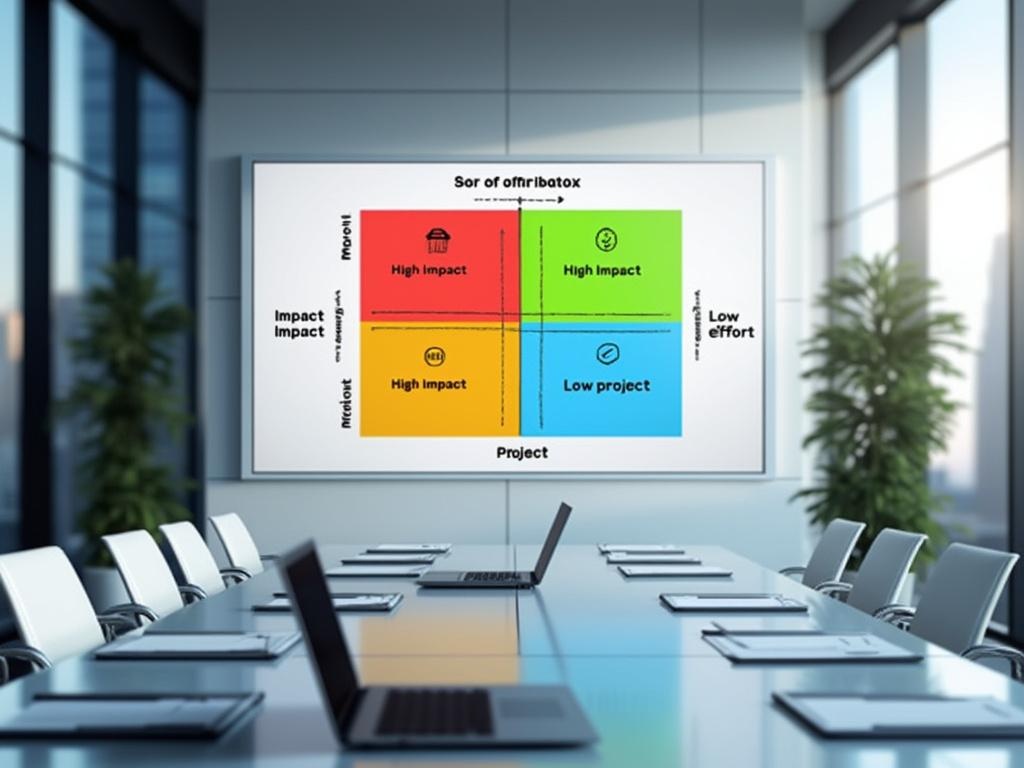
Impact and Prioritization Strategies
You’ll achieve maximum results from your lean six sigma excel initiatives by implementing effective prioritization frameworks. The Impact and Effort Matrix serves as a powerful visual tool for determining which projects deserve immediate attention. Using Excel’s charting capabilities, you can create this matrix to plot potential improvements based on expected impact versus implementation effort.
To build an effective Impact and Effort Matrix in Excel:
- Create a scatter plot with quadrants representing high/low impact and high/low effort
- Input your potential projects with numerical ratings for both dimensions
- Use conditional formatting to highlight the high-impact, low-effort opportunities
- Add data labels to clearly identify each project on the matrix
When calculating potential cost savings through lean six sigma excel methods, you’ll need standardized templates that quantify both tangible and intangible benefits. Qualitative risk assessment techniques can help evaluate the probability of success for each initiative before committing resources.
| Project Type | Impact Calculation Method | Key Excel Functions | Resource Allocation Strategy |
|---|---|---|---|
| Process Optimization | Cycle time reduction × hourly cost | SUMPRODUCT, NPV | Dedicated cross-functional team |
| Quality Improvement | Defect reduction × cost per defect | AVERAGEIF, STDEV | Part-time subject matter experts |
| Waste Elimination | Materials saved × cost per unit | FORECAST, TREND | Targeted resource assignment |
Resource optimization becomes more manageable when you apply lean six sigma excel tools to analyze capacity and constraints. Capacity planning frameworks help ensure your improvement projects don’t overburden teams while maximizing throughput of value-adding activities.
Advanced Prioritization Techniques
Beyond the basic matrix approach, lean six sigma excel provides sophisticated prioritization methodologies using weighted scoring models. These models incorporate multiple factors like strategic alignment, regulatory requirements, and technical feasibility into your decision-making process.
Consider these advanced lean six sigma excel techniques for project selection:
- Multi-criteria decision analysis using weighted scorecards
- Monte Carlo simulation for risk-adjusted project valuation
- Constraint-based optimization models for resource allocation
- Portfolio balancing tools to ensure strategic alignment
The lean six sigma excel approach transforms subjective decisions into data-driven processes. By leveraging these tools, you’ll identify the improvement initiatives that deliver maximum value with minimal investment. Continuous improvement methodologies become more effective when guided by quantitative prioritization frameworks rather than intuition alone.
Financial Benefits and Waste Reduction
You’ll gain significant financial advantages by implementing lean six sigma excel tools in your operations. These powerful spreadsheets help quantify improvements and translate them directly into monetary savings. By tracking metrics before and after process changes, you can demonstrate clear ROI to stakeholders and satisfy key stakeholders with tangible results.
Excel templates specifically designed for lean six sigma allow you to identify and calculate the 8 wastes in your processes:
- Transportation: Track unnecessary movement of materials and associated costs
- Inventory: Calculate holding costs and opportunity costs of excess inventory
- Motion: Measure wasted employee movement and time
- Waiting: Quantify labor costs during idle periods
- Overproduction: Determine expenses from creating more than needed
- Overprocessing: Identify costs from unnecessary steps
- Defects: Calculate rework, scrap, and customer impact costs
- Skills: Assess opportunity costs from underutilized talent
Each waste category can be analyzed using dedicated lean six sigma excel templates that calculate both current state and potential improvements. These tools reveal hidden costs you might not otherwise recognize.
Converting Operational Gains to Financial Savings
Lean six sigma excel tools provide structured methods for converting operational improvements into financial terms. Cost-benefit analysis templates allow you to input process metrics and automatically calculate projected savings. You’ll quickly identify high-impact projects through visual representations of financial data.
The table below shows typical financial benefits captured through lean six sigma excel analysis:
| Improvement Area | Metrics Tracked | Financial Impact |
|---|---|---|
| Cycle Time Reduction | Hours saved per process | Labor cost savings |
| Quality Enhancement | Defect reduction percentage | Rework/scrap reduction |
| Resource Optimization | Materials usage efficiency | Direct cost savings |
| Capacity Increase | Additional throughput | Revenue potential |
| Inventory Reduction | Holding cost elimination | Working capital freed |
Your lean six sigma excel tools should include NPV (Net Present Value) calculators to account for the time value of money when evaluating improvement projects. This ensures you manage your project portfolio with financial rigor.
Advanced practitioners develop customized lean six sigma excel dashboards that update automatically as process data changes. These visual management tools help you continuously monitor financial impacts and identify when processes drift from optimal performance.
By implementing lean six sigma excel tools strategically, you’ll create a data-driven culture where improvement initiatives are evaluated based on their financial contribution rather than subjective factors. This approach ensures resources are allocated to projects with maximum bottom-line impact.
Implementing Lean Six Sigma Excel Tools
You can transform your operational efficiency by leveraging Excel’s powerful capabilities for Lean Six Sigma projects. Excel serves as an accessible yet robust platform for implementing key process improvement methodologies across your organization. With the right lean six sigma excel templates, you’ll track defects, visualize data, and make evidence-based decisions without investing in expensive specialized software.
The DMAIC framework (Define, Measure, Analyze, Improve, Control) becomes significantly more manageable when you apply dedicated Excel tools at each phase. For the Define phase, you’ll benefit from project charter templates that clarify scope and objectives. During Measure, data collection sheets and process mapping tools help establish baselines. The Analyze phase leverages Excel’s statistical functions, while Improve and Control phases utilize solution selection matrices and control charts.
Here are essential lean six sigma excel tools you should incorporate into your improvement initiatives:
- Project Charter templates for scope definition and goal alignment
- SIPOC diagrams for process visualization
- Fishbone templates for comprehensive root cause analysis
- Pareto chart generators to identify the vital few causes
- Control plan templates for sustaining improvements
- Statistical analysis worksheets for calculating process capability
The true power of lean six sigma excel implementation comes from integrating statistical rigor with user-friendly data visualization. You’ll calculate critical metrics like DPMO (Defects Per Million Opportunities) using Excel formulas while creating compelling visual evidence through control charts. This statistical analysis for risk assessment helps pinpoint where process variation occurs.
Excel add-ins like QI Macros simplify complex statistical calculations, making lean six sigma accessible to professionals without extensive statistical backgrounds. These tools automate critical functions like hypothesis testing, capability analysis, and control chart creation, saving hours of manual calculation.
Implementation Strategies for Different Organizational Levels
Your implementation approach should vary based on organizational level and project complexity. Front-line teams can start with simple lean six sigma excel templates for basic problem-solving, while management might leverage more sophisticated statistical tools for strategic decision-making. This effective project leadership ensures proper tool application across all levels.
To maximize adoption, create a centralized repository of standardized lean six sigma excel templates accessible to all improvement teams. This prevents duplication of effort and ensures consistency in analysis methods. Supplement these tools with clear documentation and training resources to build organizational capability.
Many organizations have achieved remarkable results through lean six sigma excel implementation. Manufacturing companies have reduced defect rates by over 50%, healthcare providers have decreased patient wait times by 30%, and financial institutions have accelerated processing times by 40% – all using Excel-based tools for their improvement initiatives.
As you advance in your lean six sigma excel journey, consider integrating more sophisticated data analysis techniques like regression analysis and design of experiments. These methods reveal deeper process insights and optimization opportunities that drive continuous improvement across your organization.