Understanding Product Management KPI Dashboards
Product Management KPI Dashboards function as the central hub for strategic decision-making, converting data into actionable insights that propel product success. A properly constructed dashboard clarifies performance tracking by offering complete visibility into essential metrics across business performance, customer engagement, and product development.
Key Takeaways
- Product management KPI dashboards integrate metrics from business performance, customer engagement, and product development to provide a holistic view of product health.
- Effective dashboards limit views to 2-3 critical insights and use accessible, interactive visualizations.
- Dashboards help break down organizational silos and promote a data-driven culture.
- Balanced tracking of leading and lagging indicators enables both predictive and retrospective analysis.
- Strategic dashboard implementation requires regular refinement and stakeholder feedback.
Creating an effective product dashboard starts with identifying the right metrics to track. You’ll need to select indicators that align with your specific product goals and organizational objectives. The most valuable dashboards don’t overwhelm with data but instead highlight key performance patterns that matter most.
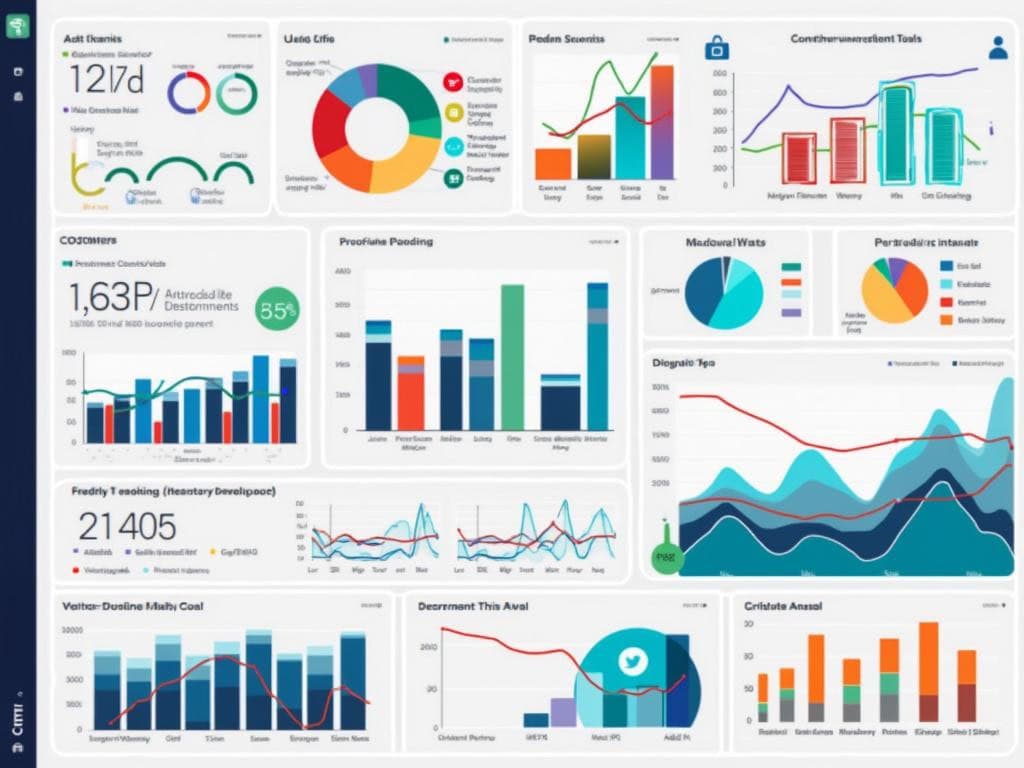
Dashboards should present information in a clear, visually appealing format that makes trends immediately apparent. Color-coding, charts, and graphs help transform raw numbers into visual stories that stakeholders can quickly understand and act upon.
For optimal results, customize your dashboard for different audiences. Executive teams might need high-level revenue metrics, while product teams benefit from detailed usage statistics. This targeted approach ensures everyone receives the information relevant to their decision-making needs.
Regular updates keep your dashboard relevant as product priorities shift. Set a schedule to review and refine the metrics you’re tracking, removing outdated KPIs and adding new ones that better reflect current strategic goals.
Implementation should involve stakeholder input to ensure buy-in across the organization. When teams contribute to dashboard development, they’re more likely to use it as a decision-making tool in their daily work.
Advanced dashboards can incorporate predictive analytics, helping you anticipate trends rather than simply reacting to them. This forward-looking capability transforms your dashboard from a reporting tool into a strategic asset that guides product innovation.
The Importance of a Unified Dashboard
The best product dashboards create a single source of truth that aligns teams around shared goals. When everyone works from the same data, cross-functional collaboration improves and organizational silos break down naturally.
Your dashboard should balance quantitative metrics with qualitative insights. While numbers tell part of the story, customer feedback and support tickets provide context that helps explain the “why” behind performance fluctuations.
“Product management KPI dashboards are the heartbeat of strategic decision-making, transforming complex data into clear insights that empower teams to drive product success. By integrating key metrics and fostering a data-driven culture, these dashboards not only illuminate performance but also break down silos, ensuring a collective focus on growth and innovation.”
Understanding Product Management KPI Fundamentals
Your product management KPI dashboard serves as the nerve center for strategic decision-making. These dashboards don’t just display numbers – they transform complex data into actionable insights that drive product success. A well-designed product management KPI dashboard brings clarity to performance tracking and helps you identify opportunities for growth.
Product management KPI dashboards fall into three primary categories that collectively provide a comprehensive view of your product’s health. Each category contains specific metrics that help you evaluate different aspects of performance:
- Business Performance Metrics:
- Average Revenue Per User (ARPU)
- Monthly Recurring Revenue (MRR)
- Revenue Growth Rate
- Customer Acquisition Cost (CAC)
- Customer Engagement Metrics:
- Daily Active Users (DAU)
- Retention Rate
- Customer Lifetime Value (CLTV)
- Net Promoter Score (NPS)
- Product Development Metrics:
- Development Cycle Time
- Feature Adoption Rate
- Bug Fix Rate
- Release Frequency
Creating an Effective Product Management KPI Dashboard
The value of your product management KPI dashboard depends on the accuracy and comprehensiveness of your data interpretation. You’ll need to establish reliable data sources and implement consistent measurement methodologies to ensure your dashboard delivers trustworthy insights.
When designing your dashboard, consider these best practices:
- Limit each dashboard view to 2-3 critical insights
- Select appropriate visualization formats for different metric types
- Use color-blind friendly palettes for accessibility
- Include interactive elements for deeper data exploration
- Ensure real-time or near-real-time data updates
A successful product management KPI dashboard helps you break down organizational silos and promotes a data-first culture. You’ll find your decision-making process accelerates as you gain immediate visibility into product performance trends. This approach also enhances stakeholder communication by providing clear, visual representations of complex data relationships.
The following table summarizes the key components your product management KPI dashboard should include:
| Dashboard Component | Purpose | Example Metrics |
|---|---|---|
| Business Health | Track financial performance | ARPU, MRR, Growth Rate |
| User Engagement | Monitor customer interaction | DAU, Retention, CLTV |
| Development Efficiency | Measure team productivity | Cycle Time, Bug Rate |
| Strategic Alignment | Assess progress toward goals | OKR completion, Roadmap adherence |
Remember to balance leading indicators (predictive metrics) with lagging indicators (outcome metrics) in your product management KPI dashboard. This balanced approach ensures you can both react to current performance and anticipate future trends.
By implementing a comprehensive product management KPI dashboard, you’ll gain the insights needed to optimize product performance and drive strategic growth.

Dashboard Design: Creating Visual Excellence
Designing an effective product management KPI dashboard requires careful consideration of visual elements that transform complex data into clear insights. Your dashboard serves as the central nervous system for product decisions, making its design crucial for driving strategic outcomes.
A well-designed product management KPI dashboard follows key principles that balance aesthetics with functionality. You’ll need to prioritize visual clarity by limiting each dashboard view to 2-3 critical insights rather than overwhelming users with excessive data points. This focused approach increases comprehension and drives action from your product management KPI dashboard.
When selecting visualization elements, choose chart types that best represent your specific metrics:
- Bar charts: Ideal for comparing values across categories like feature adoption rates
- Line charts: Perfect for tracking trends over time such as MRR growth
- Pie charts: Useful for showing proportional relationships in your product metrics
- Heat maps: Excellent for identifying patterns in user engagement data
Color selection plays a significant role in dashboard effectiveness. You should implement color-blind friendly palettes that use contrasting hues to highlight critical variations in performance metrics. Your product management KPI dashboard gains clarity when you establish a consistent color system where red indicates problems, yellow shows caution areas, and green represents success.
Interactive elements elevate your product management KPI dashboard from static reporting to dynamic analysis. Adding filter capabilities allows stakeholders to segment data based on specific timeframes, user segments, or product features. This interactivity transforms passive consumption into active exploration that drives performance improvements.
Tools for Dashboard Excellence
Several powerful tools can help you create compelling product management KPI dashboards:
- Tableau: Offers robust visualization capabilities with drag-and-drop functionality
- PowerBI: Provides deep integration with Microsoft products and strong data modeling
- Looker: Delivers exceptional SQL-based data exploration
- Justinmind: Excellent for prototyping dashboard designs before implementation
The visual structure of your product management KPI dashboard should guide users through a logical progression of insights. Start with high-level KPIs that provide an immediate snapshot of product health, then allow strategic dashboard users to drill down into more detailed metrics for deeper analysis.
Remember that effective product management KPI dashboards evolve through continuous refinement. You should regularly collect feedback from stakeholders to identify improvements in both design and content. This iterative approach ensures your dashboard remains aligned with changing business priorities and user needs.

Strategic Impact of KPI Dashboards
Your product management KPI dashboard delivers far more than just pretty charts. It’s a strategic powerhouse that transforms how your team makes decisions and drives results. A well-designed product management KPI dashboard accelerates decision-making by providing real-time insights without waiting for weekly reports. You’ll spot trends, identify issues, and capitalize on opportunities faster than competitors still relying on static reports.
Breaking down organizational silos becomes natural when everyone references the same product management KPI dashboard. When marketing, development, and customer success teams view identical metrics, cross-functional collaboration improves dramatically. The dashboard serves as a common language that helps teams align priorities and understand how their work contributes to broader product goals.
Quantifiable Benefits of Product Management KPI Dashboards
A strategic product management KPI dashboard delivers concrete benefits that justify the investment:
- Reduced reporting time: You’ll cut reporting preparation by 40-60% when automated dashboards replace manual spreadsheets.
- Increased accountability: Teams take ownership when metrics are visible and tracked consistently.
- Faster issue resolution: Problems identified through dashboard alerts get addressed 30% quicker.
- Data-driven culture: Regular dashboard use encourages decisions based on evidence rather than opinions.
- Enhanced stakeholder communication: Visual representations make complex data accessible to all stakeholders.
The right product management KPI dashboard strengthens your strategic planning efforts by connecting daily activities to long-term goals. Your dashboard should display a balanced mix of leading indicators (predicting future performance) and lagging indicators (showing historical results).
When implementing your product management KPI dashboard, focus on metrics that directly support business objectives. You’ll waste resources tracking vanity metrics that look impressive but don’t drive decisions. Instead, select KPIs that help determine whether your product strategy is working or needs adjustment.
Many organizations find that dashboards and scorecards drive performance most effectively when customized for different organizational levels. Executive dashboards might focus on revenue and market share, while team-level dashboards track development velocity and feature adoption rates.
Your product management KPI dashboard becomes especially powerful during strategic review processes, providing the evidence needed to evaluate strategy effectiveness. The visualization capabilities help stakeholders quickly grasp complex relationships between different product metrics, making strategic discussions more productive.

Critical KPIs for Comprehensive Product Management
Your product management KPI dashboard serves as the command center for data-driven decision making. With the right metrics, you’ll gain clear visibility into product performance and user behavior patterns that drive strategic actions.
A well-designed product management KPI dashboard combines financial, user engagement, and operational metrics that tell a complete story about your product’s health. You need balanced indicators that reveal both current performance and future potential.
Financial metrics form the foundation of your product management KPI dashboard by demonstrating business viability. Track metrics like Average Revenue Per User (ARPU), Monthly Recurring Revenue (MRR), and Revenue Growth Rate to ensure your product generates sustainable value. These indicators help you understand if your product is financially successful and where revenue opportunities exist.
User behavior and engagement metrics reveal how customers interact with your product. Your product management KPI dashboard should include Daily Active Users (DAU), Retention Rate, Customer Lifetime Value (CLTV), and Feature Adoption Rate. These metrics help you identify which features drive engagement and which ones need improvement.
Balancing Leading and Lagging Indicators
Your product management KPI dashboard needs both types of indicators to provide a complete picture:
- Leading Indicators (predict future performance):
- Feature Adoption Rate
- New User Activation Rate
- Customer Satisfaction Score
- Free-to-Paid Conversion Rate
- Lagging Indicators (confirm historical patterns):
- Revenue Growth
- Customer Lifetime Value
- Churn Rate
- Market Share
The following table outlines the essential metrics for a comprehensive product management KPI dashboard:
| Metric Category | Key Indicators | Purpose |
|---|---|---|
| Financial Performance | ARPU, MRR, Revenue Growth | Validate business model and profitability |
| User Engagement | DAU, Retention Rate, CLTV | Measure product stickiness and user satisfaction |
| Development Efficiency | Cycle Time, Bug Fix Rate, Deploy Frequency | Track team productivity and quality |
| Strategic Alignment | OKR Completion, Product Roadmap Progress | Ensure alignment with company objectives |
When implementing your product management KPI dashboard, focus on strategic planning priorities that align with overall business goals. Don’t overwhelm yourself with too many metrics—select 7-10 key indicators that provide the most valuable insights.
A properly configured product management KPI dashboard helps you conduct competitive analysis against industry benchmarks. This allows you to identify gaps and opportunities in your product strategy and make data-backed decisions about feature prioritization.
Remember to update your product management KPI dashboard regularly and share insights with stakeholders to maintain alignment across teams. The dashboard isn’t just for monitoring—it’s a powerful tool for facilitating project collaboration and ensuring everyone works toward common objectives.
Expert Insight: To create an effective product management KPI dashboard, focus on a balanced integration of financial, user engagement, and operational metrics to provide a holistic view of your product’s performance. Essential indicators such as ARPU, DAU, and Feature Adoption Rate not only reveal current trends but also predict future potential, enabling informed strategic decisions. Regularly update the dashboard and share insights with stakeholders to ensure alignment and foster collaboration towards achieving business goals.
Implementing and Leveraging KPI Dashboards
Creating an effective product management KPI dashboard transforms how you make decisions and track success. Your dashboard implementation strategy should be methodical and user-focused to ensure maximum adoption and value.
Start by identifying your key stakeholders and their specific information needs. Product teams, executives, and developers each require different metrics and visualization styles in their product management KPI dashboard. Gather requirements through structured interviews or workshops to ensure your dashboard addresses real business questions.
When selecting your tools, consider both immediate needs and future scalability. Popular options include:
- Power BI – Excellent for Microsoft-centric organizations
- Tableau – Strong visualization capabilities
- Looker – Google’s enterprise business intelligence platform
- Custom solutions – For specialized product management KPI dashboard requirements
Data integration represents a critical implementation step. You’ll need to connect your product management KPI dashboard to various data sources like CRM systems, product analytics tools, and financial databases. Ensure your integration strategy includes data validation protocols to maintain accuracy.
Best Practices for Dashboard Adoption
Your product management KPI dashboard implementation won’t succeed without proper adoption strategies. Training sessions demonstrate the dashboard’s value while creating product management KPI dashboard champions across departments helps maintain momentum.
Regular review cycles keep your dashboard relevant. Schedule quarterly assessments to evaluate which metrics provide actionable insights and which might need replacement. This approach supports continuous improvement principles and ensures your dashboard evolves with your product strategy.
Dashboard governance remains essential for long-term success. Establish clear ownership responsibilities, update procedures, and access controls to maintain your product management KPI dashboard integrity. These guidelines prevent dashboard sprawl and confusion.
The most successful product management KPI dashboard implementations follow an iterative approach. Start with a minimal viable dashboard focused on 3-5 critical metrics before expanding. This strategy allows teams to build comfort with data-driven decision making while providing immediate value.
Looking ahead, your product management KPI dashboard will likely incorporate predictive analytics capabilities. These advanced features help identify potential issues before they impact performance and support strategic planning by forecasting trends based on current performance indicators.
When properly implemented, your product management KPI dashboard creates a single source of truth that aligns teams around common goals and metrics. This shared understanding accelerates decision-making processes and improves product outcomes across your organization.