Understanding Project Management Flow Charts in Excel
Project management flow charts in Excel act as visual roadmaps that outline task sequences, decision points, and processes within projects. These visualization tools transform complex workflows into clear diagrams, helping teams track progress, spot dependencies, and communicate procedures effectively using software you already own.
Business Value of Project Management Flow Charts
Project management flow charts in Excel provide significant advantages for organizations aiming for efficient project execution. They offer clear visual representations of workflows that improve decision-making, minimize misunderstandings between stakeholders, and help identify potential bottlenecks before they affect deadlines.
For budget-conscious businesses, Excel-based flow charts deliver a cost-effective alternative to expensive project management software while still creating professional, dynamic visualizations that adapt with your project’s progress. The familiar Excel interface reduces training time, allowing your team to quickly implement structured project management practices.
These charts enable you to maintain visibility across complex projects, ensuring everyone understands their responsibilities and how their work connects to the broader project goals. By mapping out processes visually, you’ll gain better control over project execution and can more easily communicate project structures to clients and team members.
7 Essential Steps: Optimize Your Project Management Flow Chart in Excel
In this section, we outline seven essential steps to help you create an optimized project management flow chart using Excel. An effective flow chart can significantly enhance your project visualization capabilities, enabling better communication and collaboration among team members. By following these steps, you’ll master the core functionalities of Excel that are vital for flowchart creation, from utilizing basic tools to adding interactive elements that enhance user engagement.
Whether you are a beginner or looking to refine your existing skills, this guide provides actionable insights to streamline your project management processes. Let’s delve into these crucial elements that can elevate your flow chart from a static diagram to a dynamic project management asset.
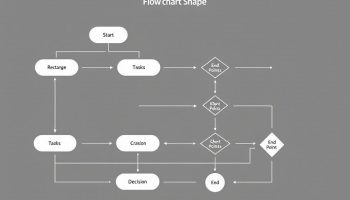
1. Master Excel’s Basic Flowchart Tools
Creating an effective project management flow chart in Excel starts with understanding the fundamental tools available. Excel offers several built-in features that make flowchart creation straightforward even without specialized software. The SmartArt graphics functionality provides pre-designed layouts that can be customized for your project management flow chart needs. Excel’s shape library contains all standard flowchart symbols including process boxes, decision diamonds, and connectors essential for visualizing workflows.
The connector tools are particularly valuable when linking elements in your project management diagram, allowing you to create relationships between tasks that automatically adjust when you move shapes. Quick Style options ensure consistency throughout your flowchart, saving time while maintaining a professional appearance across your project documentation. These basic tools form the foundation for effective project management visualization in Excel.
Here are the essential tools to master:
- SmartArt graphics functionality for quick flowchart creation
- Shape library containing standard flowchart symbols
- Connector tools that maintain links between elements
- Quick Style options for professional consistency
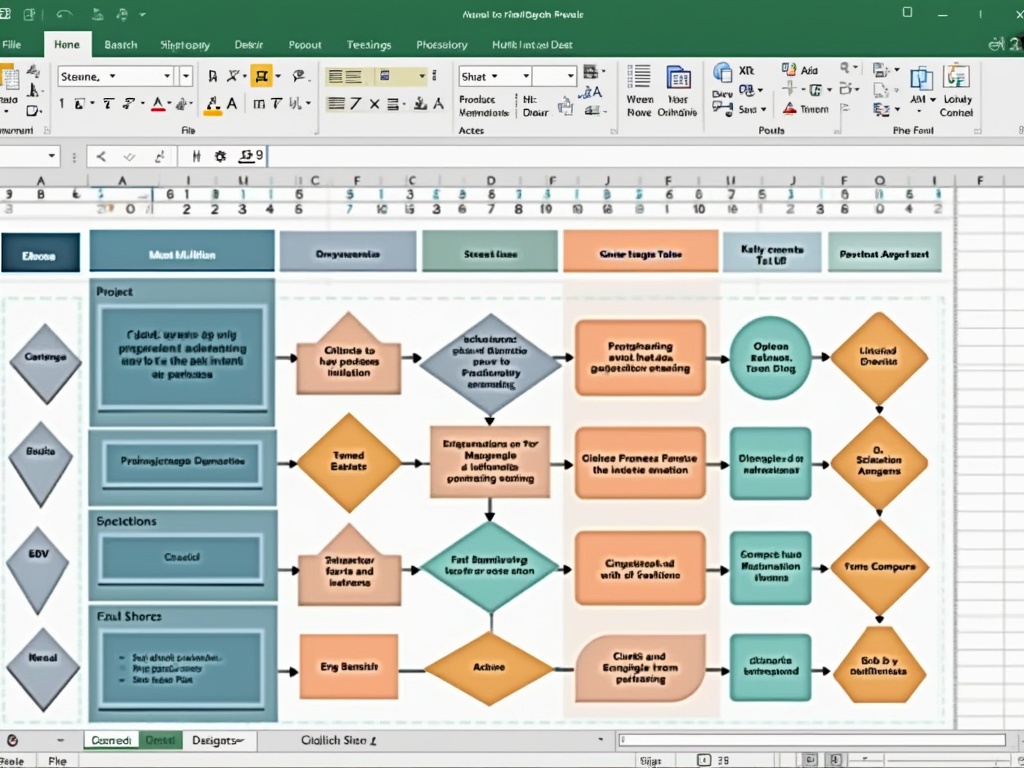
2. Set Up Your Flowchart Grid System
Creating an effective project management flow chart in Excel starts with establishing a proper grid system. When building your flowchart, enable the gridlines and snap-to-grid features to ensure precise placement of shapes and connectors. These features, found under the View tab, help maintain alignment throughout your project management flow chart in Excel.
Set optimal spacing measurements by adjusting the grid settings to match your flowchart’s complexity. For detailed project workflows, configure smaller grid intervals (0.1 or 0.2 inches); for simpler flowcharts, larger intervals work well. This precision is crucial when communicating project workflows to stakeholders.
Create alignment guides by holding Shift while dragging from the rulers. These guides help position elements consistently across your flowchart, especially when working with multiple decision points or process branches. Consider these practical grid settings:
- Enable “Snap to Grid” under Drawing Tools > Format > Arrange
- Set grid spacing to 0.25 inches for standard flowcharts
- Use cell borders as natural guidelines for shape placement
- Align text consistently within shapes
A well-structured grid system forms the foundation for a clear, professional project management flowchart that team members can easily follow.
Expert Insight: To create an effective project management flowchart in Excel, start by enabling gridlines and the snap-to-grid feature for precise placement of shapes. Adjust grid settings based on complexity and ensure consistent alignment of elements using alignment guides. This precision enhances clarity and facilitates better communication of workflows to stakeholders.
3. Choose the Right Flowchart Shapes
When creating a project management flow chart in Excel, selecting appropriate shapes is crucial for clear communication. The right symbols help stakeholders instantly understand process flows and decision points. Standard process boxes represent primary tasks or activities in your project management flow chart Excel template.
Decision diamonds indicate points where the flow branches based on yes/no questions, helping you visualize alternative paths in your project timeline. Start/end terminals clearly mark the beginning and conclusion of processes, establishing boundaries for each workflow segment.
Input/output parallelograms show where data enters or exits the process, which is particularly valuable when tracking collaborative project inputs. Consider these additional shape options for comprehensive flowcharts:
- Document symbols for reports or deliverables
- Database cylinders for information storage
- Cloud shapes for external systems
- Delay symbols for waiting periods
- Sub-process rectangles for linked workflows
Consistently applying these shapes will help you create standardized procedural diagrams that your team can easily interpret and follow throughout the project lifecycle.
Expert Insight: Choose the right flowchart shapes in Excel to enhance clarity and communication. Utilize standard symbols for tasks, decision points, and data inputs/outputs to represent your project flow accurately. Consistent application of these shapes ensures that your team can easily interpret and follow the workflow throughout the project lifecycle.
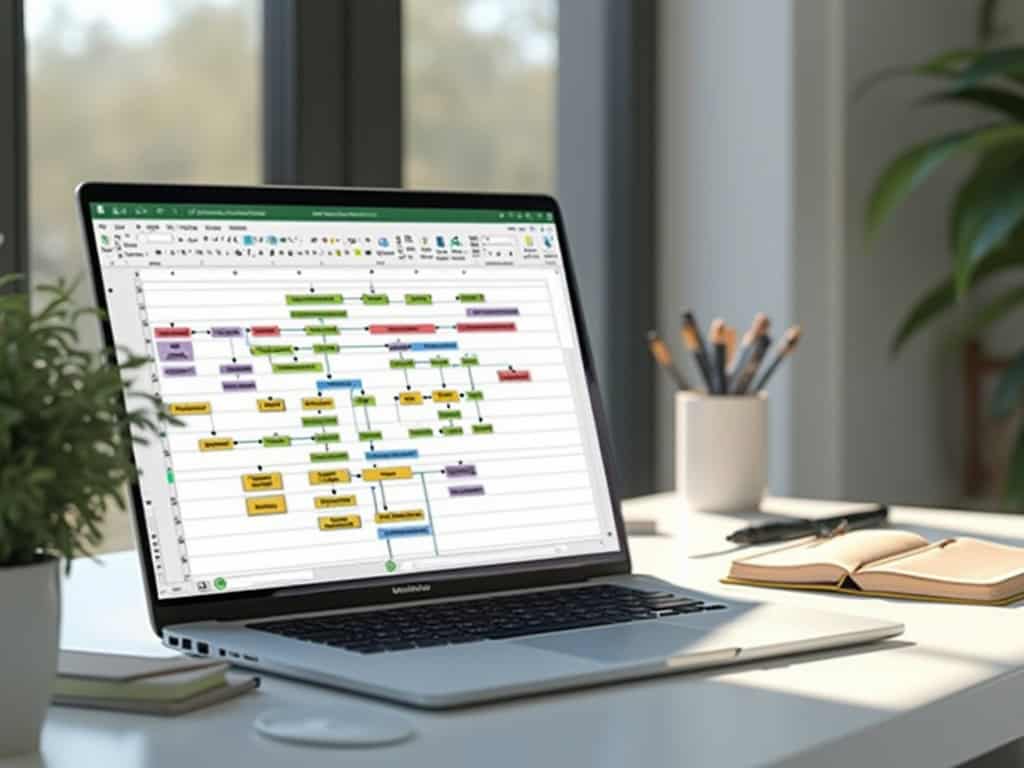
4. Create Dynamic Data Connections in Your Project Management Flow Chart Excel
Creating dynamic data connections within your project management flow chart Excel document allows you to build a living, responsive visualization tool. When you link shapes to your actual project data, your flow chart becomes more than just a static diagram—it transforms into an active project management asset.
Start by establishing connections between your flowchart shapes and the corresponding data in your spreadsheet. Select a shape, then use the Data tab to create a link to specific cells containing task information, deadlines, or resource allocations. This integration helps you enhance project collaboration since everyone works with the same real-time information.
Set up automatic updates by configuring refresh parameters so your flow chart reflects the most current project status without manual intervention. You can implement this through:
- Data validation rules that maintain data integrity
- Two-way cell references that update bidirectionally
- Conditional formatting that visually indicates status changes
- Dynamic text displays that show current metrics
These connections create a powerful project management flow chart Excel system that evolves as your project progresses, keeping stakeholders informed and enabling better decision-making.
Expert Insight: Establish dynamic data connections in your Excel project management flow chart by linking shapes to live spreadsheet data. Use automatic updates, data validation, and conditional formatting to reflect real-time project status. This approach enhances collaboration and empowers stakeholders with current information for informed decision-making.
5. Implement Smart Connectors for Project Management Flow Chart Excel
Creating effective project management flow chart excel visualizations requires mastering connector functionality. Smart connectors serve as the roadmap guiding viewers through your process logic. When implementing connectors in your project management flow chart excel workbook, begin with elbow connectors rather than straight lines to maintain clarity between nodes.
Set automatic routing options by right-clicking any connector and selecting “Reroute Connectors” to optimize the path between shapes. This feature intelligently adjusts as you move elements around your flowchart, saving significant time during revisions. You can further enhance your project schedule using Excel by configuring connection points on each shape.
Consider these connector implementation best practices:
- Anchor connectors to specific points on shapes for consistent alignment
- Use different arrow styles to indicate various types of relationships
- Apply consistent formatting to connectors that serve similar functions
- Enable automatic connector adjustment to maintain clean layouts when shapes move
Proper connector implementation prevents the visual clutter that often plagues complex project flowcharts, ensuring stakeholders can easily follow process flows during planning meetings.
Expert Insight: To enhance project management flow charts in Excel, utilize smart connectors for clear process visualization. Start with elbow connectors for better clarity, enable automatic routing to streamline revisions, and anchor connectors to shape points to prevent visual clutter, ensuring stakeholders easily follow the project flow.
6. Format for Visual Clarity
Creating a project management flow chart in Excel requires attention to visual clarity for maximum effectiveness. Your project management flow chart Excel document should incorporate consistent color schemes that align with your organization’s branding while ensuring good contrast for readability. Choose colors that visually separate different process stages or priority levels.
Clear typography choices are essential when developing your flow chart. Select fonts that remain readable even when viewed on different devices or printed. Consider using:
- Sans-serif fonts like Arial or Calibri for better screen readability
- Consistent font sizes (10-12pt for content, 14-16pt for headings)
- Bold formatting only for important decision points
- Limited italic use to avoid cluttering
Appropriate shape sizing helps maintain clear communication in your project flow chart. Standardize dimensions for similar elements while adjusting size to reflect importance. Strategic white space usage prevents your project management flow chart from appearing crowded, allowing viewers to easily follow the process flow and understand relationships between tasks.
When implementing these formatting principles, remember that simplicity enhances comprehension. Your goal is to create a visual tool that team members can understand at a glance without requiring extensive explanation.
7. Add Interactive Elements to Your Project Management Flow Chart Excel
Enhancing your project management flow chart Excel with interactive elements transforms it from a static diagram into a dynamic tool. When creating a comprehensive project management flow chart in Excel, adding interactivity improves both usability and engagement for all stakeholders involved.
To make your flow chart more functional, consider implementing these interactive features:
- Hyperlinks between sheets: Connect related information across your workbook by creating clickable links from flowchart shapes to detailed worksheets containing task specifics, resource allocations, or timeline data.
- Action buttons: Add customized buttons that trigger macros to update data, filter information, or navigate through different project phases.
- Tooltip information: Embed helpful explanations that appear when users hover over specific elements, providing context without cluttering your flow chart.
- Collapsible sections: Create expandable/collapsible groups to manage complex project management flow charts by allowing users to focus on relevant sections.
These interactive elements significantly improve project collaboration by making your Excel flow chart more intuitive to navigate. For complex projects, consider adding conditional formatting to highlight critical paths or potential roadblocks based on dynamic data inputs.

Project Management Flow Chart Excel Tools
Project management flow chart Excel tools provide a powerful yet accessible way to visualize complex workflows and process sequences without specialized software. These customizable diagrams leverage Excel’s built-in functionality to create clear, interactive representations of project phases, decision points, and task relationships that enhance team understanding and execution.
Benefits of Using Project Management Flow Charts in Excel
- Standardization of Processes: Flow charts enable organizations to establish consistent workflows.
- Improved Communication: Visual representations facilitate better understanding among team members.
- Identification of Bottlenecks: Organizations can pinpoint inefficiencies within existing systems.
By creating visual representations of workflows that integrate with live project data, enterprises can enhance decision-making, maintain accountability across teams, and efficiently onboard new team members while ensuring consistent execution of business processes.