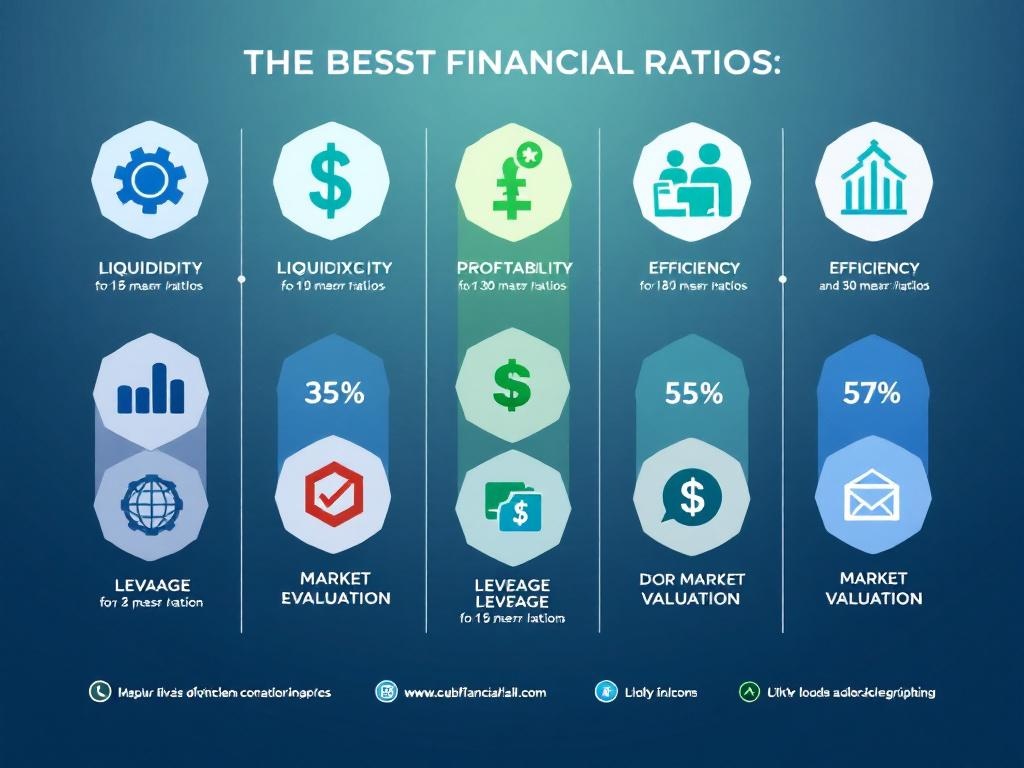
Useful financial ratios provide essential metrics for evaluating business performance across multiple dimensions. Nine key ratios—Current Ratio, Quick Ratio, Net Profit Margin, Return on Equity, Inventory Turnover, Debt-to-Equity, Price-to-Earnings, Operating Cash Flow Ratio, and EBITDA Margin—offer critical insights into a company’s liquidity, profitability, efficiency, leverage, and market valuation, creating a comprehensive financial assessment framework.
Why Financial Ratios Matter to Businesses
Financial ratios such as the Current Ratio, Quick Ratio, and Net Profit Margin function as vital decision-making tools for executives managing business operations. These metrics convert raw financial data into actionable intelligence, allowing leaders to spot operational inefficiencies, evaluate liquidity positions, and make evidence-based strategic decisions.
For investors and stakeholders, these useful financial ratios establish standardized benchmarks for performance comparison across different companies and industries. They also help management teams identify early warning signs of financial challenges before they develop into significant problems.
Regular monitoring of these nine essential useful financial ratios enables businesses to maintain financial discipline, optimize how resources are allocated, and build greater resilience against market fluctuations. Your company’s financial health becomes much clearer when you track these metrics consistently.
Financial ratios don’t just reveal where you stand—they show where you’re heading. Each ratio tells part of your business story, from your ability to pay short-term obligations to how effectively you’re generating profits from assets.
A company’s financial ratios are not just numbers; they provide a roadmap for sustainable growth, helping to navigate through complexities and challenge areas in business operations.
9 Useful Financial Ratios: Master Your Business’s Financial Health Today
In today’s competitive business environment, understanding your financial metrics is essential for success. This section outlines nine useful financial ratios that offer valuable insights into different aspects of your company’s financial performance. From liquidity measures like the Current Ratio to profitability indicators such as the Net Profit Margin and the EBITDA Margin, these ratios help in assessing your business’s overall health and operational efficiency. By closely monitoring these metrics, you can make informed decisions, optimize your strategies, and improve your financial outcomes. Whether you are a business owner or an investor, knowing these financial ratios will equip you with the knowledge to enhance your company’s performance and safeguard against potential risks. Dive in to explore each ratio and learn how they can impact your bottom line.
1. The Current Ratio: Understanding Your Short-Term Financial Health
The current ratio is one of the most useful financial ratios for assessing your company’s liquidity position. Calculated by dividing current assets by current liabilities, this ratio helps determine if your business can meet its short-term obligations using available assets. Most financial experts suggest a healthy current ratio falls between 1.5 and 3.0, though this varies significantly by industry.
Manufacturing businesses typically maintain higher ratios due to inventory requirements, while service companies often operate effectively with lower values. Watch for warning signs like a steadily declining ratio or values consistently below 1.0, which may indicate cash flow problems requiring immediate attention.
To optimize this ratio, consider:
- Accelerating accounts receivable collection
- Negotiating extended payment terms with suppliers
- Implementing strategic planning for inventory management
Remember that an excessively high ratio might suggest inefficient use of assets that could be better deployed for growth opportunities.
2. Quick Ratio: Testing Your Immediate Liquidity Position
The Quick Ratio stands as one of the most useful financial ratios when you need to assess your business’s ability to cover short-term obligations without relying on inventory sales. Calculated as (Current Assets – Inventory) ÷ Current Liabilities, this ratio provides a more stringent liquidity test than the Current Ratio by excluding inventory, which might take time to convert to cash.
You should prioritize the Quick Ratio over the Current Ratio when your business operates in industries where inventory moves slowly or when analyzing companies during economic uncertainty. A Quick Ratio of 1.0 or higher generally indicates that your company can meet immediate obligations without selling inventory.
When interpreting results, consider your business model carefully. Retail businesses might show lower Quick Ratios yet remain healthy because of rapid inventory turnover, while service-based companies should maintain higher ratios. If your ratio falls below industry standards, consider improving your strategic planning to address potential liquidity challenges before they affect operations.
Expert Insight: The Quick Ratio is essential for assessing your business’s capacity to meet short-term liabilities without relying on inventory sales. Aim for a Quick Ratio of 1.0 or higher, especially in slow-moving inventory sectors. Adjust your strategic planning if your ratio falls below industry standards to safeguard liquidity.
3. Net Profit Margin: Measuring Your Bottom-Line Efficiency
The net profit margin is one of the most useful financial ratios for evaluating your business’s overall profitability. Calculated by dividing net profit by revenue and multiplying by 100, this ratio reveals what percentage of your sales actually translates into profit after all expenses are deducted.
When analyzing your company’s financial health, net profit margin provides critical insights into operational efficiency and pricing strategy effectiveness. Most industries consider a 10-15% margin healthy, though this varies significantly by sector. Technology companies often enjoy margins exceeding 20%, while retail businesses typically operate with thinner margins of 2-5%.
To improve your net profit margin, consider these strategies:
- Conduct regular price optimization analyses
- Implement cost-reduction initiatives in non-value-adding areas
- Streamline operations to eliminate waste
- Focus on higher-margin products or services
Tracking this ratio quarterly helps you spot concerning trends before they become serious problems. Many successful companies use strategic planning frameworks to set specific net profit margin targets that drive decision-making throughout the organization.
Remember that interpreting your net profit margin requires competitive context—what’s considered excellent performance varies dramatically between industries and business models.
Expert Insight: To enhance your net profit margin, regularly analyze pricing strategies, cut costs in non-essential areas, and streamline operations. Monitor this metric quarterly to detect trends early and set specific targets aligned with industry benchmarks for effective decision-making and improved profitability. Context is crucial when evaluating performance.
4. Return on Equity (ROE): Evaluating Shareholder Value Creation
The Return on Equity (ROE) stands as one of the most useful financial ratios for measuring how efficiently a company generates profits from shareholders’ investments. Calculated by dividing Net Income by Shareholders’ Equity, this metric reveals how many dollars of profit a company produces with each dollar of shareholders’ equity. For investors and business owners alike, ROE offers crucial insights into management’s effectiveness at deploying capital.
When analyzing your company’s financial performance, pay attention to ROE trends over time rather than isolated figures. A consistently high ROE (generally above 15%) typically indicates strong management and effective strategic planning that creates lasting value. However, exceptionally high ROE might signal excessive leverage rather than operational excellence.
Warning signs to monitor include:
- Declining ROE over multiple quarters
- ROE significantly below industry averages
- Volatile ROE with large fluctuations
Positive indicators include:
- Stable or gradually improving ROE
- ROE outperforming industry peers consistently
- Rising ROE accompanied by increasing net profit margins
The relationship between ROE and capital structure decisions makes this ratio particularly valuable when evaluating your company’s cost-benefit analysis of different financing options.
Expert Insight: To effectively gauge shareholder value creation, monitor ROE trends rather than isolated figures. Aim for a stable or improving ROE above 15% to indicate strong management, and be cautious of declining or volatile values that may signal issues. Always consider the impact of capital structure on ROE analysis.
5. Inventory Turnover Ratio: Optimizing Your Product Management
The Inventory Turnover Ratio is one of the most useful financial ratios for assessing how efficiently your company manages its inventory. Calculated as Cost of Goods Sold ÷ Average Inventory, this metric reveals how many times you sell and replace inventory during a specific period. A higher ratio typically indicates better inventory management and more efficient sales processes.
When analyzing this ratio, you need to consider industry norms. Retail grocery stores may have ratios exceeding 100, while automobile dealers might operate efficiently with ratios below 10. Your business’s optimal inventory turnover depends on your specific market and product type.
To improve this ratio, consider these approaches:
- Implement just-in-time inventory systems to reduce holding costs
- Use data analytics tools to predict demand patterns
- Develop supplier relationships that allow for smaller, more frequent orders
- Identify and liquidate slow-moving inventory
Finding the right balance is crucial—too high a turnover might lead to stockouts and dissatisfied customers, while too low suggests capital tied up in excess inventory. Regular monitoring helps you optimize inventory investments while maintaining customer satisfaction.
Expert Insight: To optimize your Inventory Turnover Ratio, regularly analyze industry benchmarks and tailor strategies to your market. Implement just-in-time systems, leverage data analytics for demand forecasting, and manage supplier relationships for flexibility. Striking the right balance prevents stockouts and minimizes excess inventory, enhancing overall efficiency and customer satisfaction.
6. Debt-to-Equity Ratio: Managing Financial Risk Exposure
The Debt-to-Equity ratio is one of the most useful financial ratios for assessing a company’s leverage and risk profile. Calculated by dividing Total Liabilities by Total Equity, this ratio reveals how much a business relies on debt versus owner investments to finance its assets. A high ratio indicates that a company is primarily financing growth through debt, potentially creating greater financial risk during economic downturns.
When analyzing your company’s financial health, understanding this ratio helps you make strategic decisions about capital structure. Most industries consider a ratio between 1.5 and 2.0 acceptable, though this varies significantly by sector. Capital-intensive industries like manufacturing typically operate with higher ratios than service-based businesses.
Strategic approaches to managing this ratio include:
- Gradual debt reduction through accelerated repayment plans
- Equity injections through new investment or retained earnings
- Asset sales to reduce liabilities while maintaining equity levels
- Risk appetite management aligned with long-term growth goals
By monitoring your Debt-to-Equity ratio regularly, you can balance the tax advantages of debt financing against the flexibility and security that comes with higher equity positions.

7. Price-to-Earnings (P/E) Ratio: Gauging Market Expectations
The Price-to-Earnings (P/E) ratio stands among the most useful financial ratios for evaluating stock investments. Calculated by dividing a company’s current share price by its earnings per share (EPS), this ratio reveals how much investors are willing to pay for each dollar of earnings.
When analyzing P/E ratios, you should always compare them within the same industry since different sectors typically have different baseline expectations. A high P/E ratio might indicate investors expect significant future growth, while a low ratio could suggest undervaluation or potential concerns about the company’s prospects.
To effectively use P/E ratios in your investment strategy:
- Compare a company’s current P/E to its historical average
- Evaluate against industry peers and market averages
- Consider the company’s growth rate (using PEG ratio as extension)
- Assess alongside other valuation metrics for a complete picture
The P/E ratio can be particularly valuable when planning strategic investment timing decisions, helping you identify potentially overvalued or undervalued opportunities. Remember that extremely high P/E ratios might indicate speculative pricing, especially in volatile market conditions.

8. Operating Cash Flow Ratio: Ensuring Sustainable Operations
The Operating Cash Flow Ratio stands among the most useful financial ratios for evaluating a business’s ability to cover short-term liabilities with cash generated from operations. Calculated as Operating Cash Flow ÷ Current Liabilities, this ratio reveals whether your company produces sufficient cash to pay its immediate obligations without relying on external financing.
Unlike profit-based measures, which can be manipulated through accounting practices, this cash-focused ratio provides a clearer picture of your actual financial health. A ratio above 1.0 indicates you can cover current liabilities with operational cash flow alone—a sign of financial resilience.
Watch for these early warning signals when analyzing your operating cash flow ratio:
- Consistent downward trend over multiple periods
- Ratio falling below industry averages
- Large gap between this ratio and profit-based metrics
- Seasonal fluctuations that dip below 0.5
By monitoring cash flow patterns regularly, you can anticipate liquidity challenges before they become critical. Companies with strong operating cash flow ratios typically enjoy greater flexibility during economic downturns and better terms from suppliers and creditors.

9. EBITDA Margin: Assessing Core Operational Profitability
The EBITDA margin stands as one of the most useful financial ratios for evaluating a company’s **operational efficiency** before accounting manipulations come into play. Calculated as EBITDA (Earnings Before Interest, Taxes, Depreciation, and Amortization) divided by total revenue, this ratio reveals how much operating cash is generated for each dollar of revenue earned.
Unlike net profit margin, the EBITDA margin eliminates the effects of financing and accounting decisions, offering a clearer picture of core business performance. This makes it particularly valuable when comparing companies with different capital structures or tax situations within the same industry.
For investors conducting income statement analysis, a steady or improving EBITDA margin typically indicates **strong operational management** and potential for **sustainable growth**. Industry benchmarks vary significantly:
- Software companies often maintain EBITDA margins of 20-30%
- Retail businesses might operate with margins of 5-10%
- Manufacturing entities typically range between 10-20%
To improve your EBITDA margin, focus on **operational efficiency initiatives**, thoughtful pricing strategies, and careful management of **variable costs** without compromising **product quality** or **customer service levels**.
Financial ratios including Current Ratio, Quick Ratio, Net Profit Margin, ROE, Inventory Turnover, Debt-to-Equity, P/E, Operating Cash Flow, and EBITDA Margin serve as essential diagnostic tools for evaluating business performance across multiple dimensions. These nine metrics provide critical insights into liquidity, profitability, efficiency, and financial stability, enabling business leaders to make data-driven decisions that enhance operational outcomes and strategic positioning.
These financial ratios are indispensable for enterprise users because they transform complex financial data into actionable intelligence that drives better decision-making across all organizational levels. The Current Ratio and Quick Ratio help managers assess short-term liquidity risks, while Net Profit Margin and EBITDA Margin reveal operational efficiency opportunities. ROE and Debt-to-Equity ratios guide optimal capital structure decisions, Inventory Turnover optimizes supply chain management, P/E ratio informs investment timing, and Operating Cash Flow ratio ensures sustainable operations during market fluctuations. Together, these metrics create a comprehensive financial dashboard that enables businesses to identify strengths, address weaknesses, and maintain competitive advantage.
Conclusion
Financial ratios including Current Ratio, Quick Ratio, Net Profit Margin, ROE, Inventory Turnover, Debt-to-Equity, P/E, Operating Cash Flow, and EBITDA Margin provide essential insights for business success. These nine metrics serve as powerful diagnostic tools that transform complex financial data into clear indicators of company health across liquidity, profitability, efficiency, and risk dimensions, enabling leaders to make informed decisions that drive sustainable growth and competitive advantage.
Actionable Steps
- Establish a quarterly financial ratio review process that tracks all nine key metrics against industry benchmarks and your historical performance.
- Create customized ratio targets based on your specific industry, business model, and growth stage to ensure relevant performance evaluation.
- Implement automated dashboards that calculate and visualize ratio trends over time, making financial data accessible to decision-makers.
- Develop response protocols for when key ratios fall outside acceptable ranges, with specific action plans for addressing different scenarios.
- Train department managers on how ratio analysis impacts their operational decisions, creating organization-wide financial literacy.