Value Stream Mapping: Enhancing Efficiency in Organizational Processes
Value stream mapping identifies and eliminates inefficiencies in organizational processes. This technique analyzes each process step to separate value-creating activities from those consuming resources without benefiting customers. The result? Transformed operations and reduced waste.
Key Takeaways
- Value stream mapping reveals hidden inefficiencies by categorizing activities into value-added, necessary non-value-added, and pure non-value-added waste.
- Businesses can lose up to 30% of operational efficiency through non-value-added activities.
- Eight common types of non-value added waste include:
- Overproduction
- Waiting
- Transport
- Overprocessing
- Inventory
- Motion
- Defects
- Unused employee creativity
- Identifying and eliminating non-value-added activities can lead to significant improvements in lead times, operational costs, and customer satisfaction.
- Successful implementation requires cross-functional collaboration and a continuous improvement mindset.
The efficiency of your operations directly impacts your bottom line. By implementing value stream mapping techniques, you’ll gain clear visibility into where waste occurs in your processes. This visual tool helps you spot activities that don’t add value to your customers or products.
Non-value added activities drain resources without contributing to what customers actually pay for. These activities often hide in plain sight, masquerading as essential operations while silently eroding profitability.
Research shows companies typically waste 20-30% of their operational capacity on these non-productive activities. Eliminating them creates immediate opportunities for cost reduction and productivity gains.
The manufacturing industry has identified eight primary types of waste through lean methodology practices. These include:
- Overproduction: Making more than needed or before it’s needed
- Waiting: Idle time between process steps
- Transport: Unnecessary movement of materials
- Overprocessing: Adding features customers don’t value
- Inventory: Excess materials or products
- Motion: Unnecessary movement of people
- Defects: Quality issues requiring rework
- Unused talent: Failing to utilize employee skills and ideas
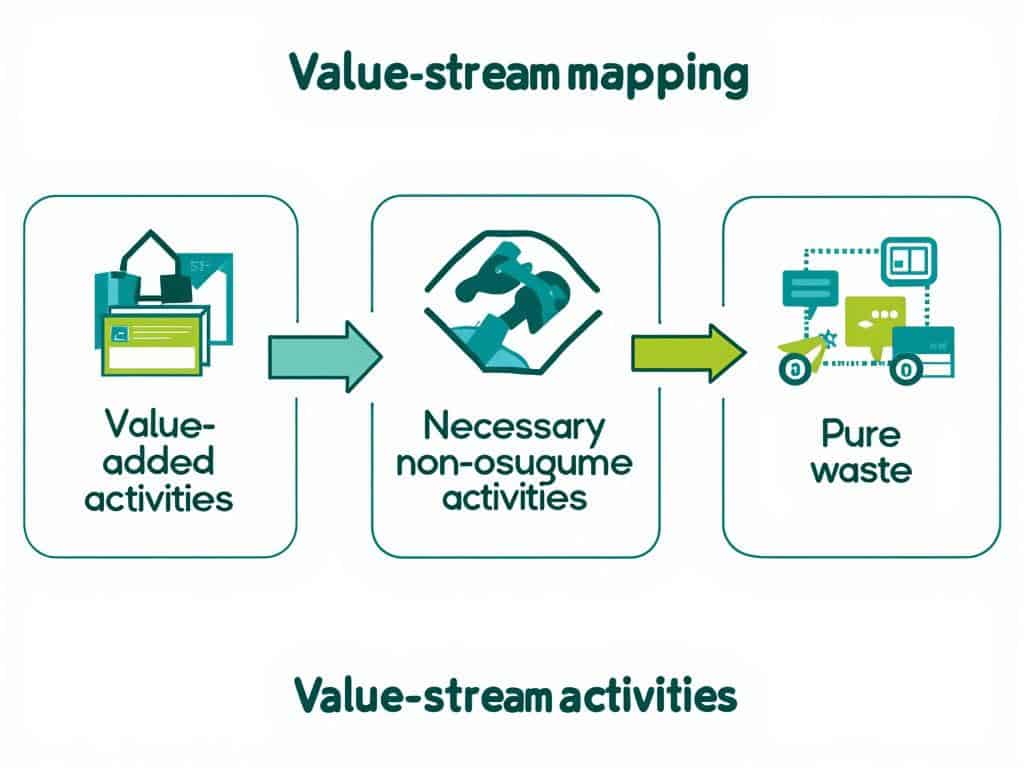
Your mapping process should focus on distinguishing between three categories of activities:
- Value-added: Activities customers willingly pay for
- Necessary non-value-added: Required activities that don’t directly add value (regulatory compliance, etc.)
- Pure waste: Activities that add no value and can be eliminated
Start by creating a current state map showing how processes actually function today. This provides a baseline for improvement and helps identify immediate waste reduction opportunities.
Next, develop a future state map representing your ideal workflow after eliminating or reducing non-value activities. This becomes your improvement roadmap.
For maximum impact, include cross-functional team members in your mapping sessions. People closest to the work often have the best insights into waste sources and potential solutions.
Digital value stream mapping tools can simplify this process, allowing for easier updates and scenario planning compared to traditional paper methods.
The benefits of eliminating non-value activities extend beyond cost savings. You’ll see improved quality, shorter lead times, enhanced employee engagement, and ultimately, higher customer satisfaction.
Remember that value stream improvement isn’t a one-time project but an ongoing process. Regular reviews and updates ensure your processes stay optimized as conditions change.
“Value stream mapping is a transformative lens that highlights hidden inefficiencies, empowering organizations to eliminate non-value-added activities and reclaim up to 30% of their operational efficiency. By fostering a culture of cross-functional collaboration and continuous improvement, businesses can not only streamline processes but also elevate customer satisfaction and operational performance.”
Understanding Value and Non-Value-Added Activities
Value stream mapping helps you distinguish between what truly creates value for customers and what doesn’t. When examining your processes through value stream mapping, you’ll categorize activities based on their contribution to customer value. Value-added activities directly transform your product or service in ways customers willingly pay for. These activities change the fit, form, or function of materials or information in alignment with customer requirements.
Non-value added activities consume resources without providing direct customer benefit. These activities represent a prime opportunity for process improvement when conducting value stream mapping non-value added analysis. By identifying and reducing these steps, you can significantly enhance efficiency and reduce waste.
Three Types of Process Activities
When conducting value stream mapping non-value added identification, you’ll typically classify activities into three categories:
- Pure value-added activities – Steps that directly transform the product or service in ways the customer values (typically less than 5% of total process time)
- Necessary non-value-added activities – Steps that don’t create customer value but are required under current conditions (regulations, technology limitations)
- Pure non-value-added waste (Muda) – Activities consuming resources without any benefit that should be eliminated
Understanding these distinctions is crucial when performing value stream mapping non-value added analysis. The process reveals where your resources are being consumed without contributing to customer satisfaction. By implementing continuous improvement strategies, you can transform your operations by systematically eliminating these inefficiencies.
The eight common types of non-value added waste to identify during value stream mapping include:
- Overproduction – Making more than needed or before it’s required
- Waiting – Idle time when materials, information, people, or equipment aren’t ready
- Transport – Unnecessary movement of materials or information
- Overprocessing – Doing more work than required by customer specifications
- Inventory – Excess materials, information, or work-in-process
- Motion – Unnecessary movement of people or equipment
- Defects – Errors requiring rework or correction
- Unused employee creativity – Failing to leverage available knowledge and skills
By focusing on value stream mapping non-value added activities, you’ll transform your process efficiency while implementing optimization methods that directly improve customer experience and operational performance.
Businesses lose as much as 30% of their operational efficiency to non-value-added activities.
hbr.org
Value Stream Mapping Process
You’ll transform your operational efficiency by mastering the value stream mapping (VSM) process. This powerful technique reveals hidden inefficiencies by tracing the flow of materials and information from suppliers to customers. When properly implemented, VSM helps identify non-value added activities that consume resources without creating customer benefit.
Creating Your Current State Map
The first crucial step in value stream mapping begins with documenting your current process flow. This detailed visualization captures every step in your workflow, highlighting where non-value added activities occur. To create an effective current state map:
- Gather a cross-functional team to ensure complete process visibility
- Walk the actual process from start to finish, documenting each step
- Record cycle times, changeover times, and inventory levels
- Identify information flows alongside material movements
- Document waiting periods and bottlenecks
Non-value added activities become apparent when you analyze your current state map carefully. These might include excessive transportation, unnecessary inventory, or redundant approvals that add time but not customer value.
A comprehensive current state map allows you to quantify waste in your process. The table below shows typical metrics to measure when identifying non-value added activities:
| Metric | Description | Impact on Value Stream |
|---|---|---|
| Process Time | Time spent actually transforming the product | Value-adding activity |
| Wait Time | Time product spends waiting between steps | Non-value added waste |
| Transportation Distance | Physical movement between process steps | Non-value added waste |
| Inventory Levels | WIP between process steps | Non-value added waste |
| Defect Rate | Quality issues requiring rework | Non-value added waste |
After completing your current state analysis, you’ll develop a future state map that eliminates or minimizes non-value added activities. This roadmap guides your process optimization methods to create a leaner workflow focused on value creation.
Your VSM process continues with implementation planning that converts the future state map into actionable improvements. Prioritize high-impact changes that eliminate the most significant non-value added activities first. Establish clear continuous improvement metrics to track your progress toward eliminating waste.
Value stream mapping non-value added activities provides quantifiable benefits, including reduced lead times, lower operational costs, and improved customer satisfaction. By systematically identifying and eliminating activities that don’t add value, you’ll create more efficient processes that deliver better results with fewer resources.
Organizations that excel at value stream mapping can see up to a 25% reduction in lead times and a 30% decrease in operational costs.
forbes.com
Waste Identification and Elimination Strategies
Value stream mapping reveals hidden inefficiencies in your organizational processes by distinguishing between value-creating and non-value-creating steps. When you implement this powerful technique correctly, you can identify non-value added activities that consume resources without delivering direct customer benefits. Many companies have achieved lead time reductions of up to 50% by systematically eliminating these wasteful processes.
Identifying Non-Value Added Activities
You can categorize non-value added activities into three distinct types:
- Pure waste (Muda) – Activities that can be eliminated immediately without affecting product quality or business requirements
- Necessary waste – Activities that don’t add value but are required under current processes
- Hidden waste – Activities embedded within processes that appear necessary but can be redesigned
The value stream mapping non-value added analysis helps you visualize where time and resources are being consumed without contributing to customer value. Common non-value added activities include excessive approvals, redundant documentation, and unnecessary movement of materials or information.
When conducting a value stream mapping exercise, apply these effective identification techniques:
- Process timing – Measure the actual duration of each process step
- Wait time analysis – Identify periods where work sits idle between activities
- Travel distance mapping – Calculate unnecessary movement of materials or people
- Information flow assessment – Trace delays in decision-making or approvals
- Inventory accumulation points – Locate areas where work-in-process builds up
After identifying non-value added activities, you can prioritize elimination strategies based on impact and implementation difficulty. Process improvement initiatives should target the most significant waste areas first while building momentum for broader transformation.
Successful organizations utilize value stream mapping non-value added analysis to create a continuous improvement culture. By establishing regular mapping cycles, you maintain awareness of emerging inefficiencies and prevent process degradation over time. This approach supports project portfolio management by ensuring resources focus on the highest-impact improvement opportunities.
Value stream mapping non-value added activities often reveal surprising insights about where your organization’s resources are being consumed. For example, many companies discover that over 90% of their process time consists of waiting or other non-value activities. This visualization provides compelling evidence for change and helps overcome resistance to process redesign.

Tools and Techniques
When implementing value stream mapping non value added activity identification, you’ll need specific tools to systematically reveal and eliminate waste. Value stream mapping software provides digital platforms that simplify the complex mapping process while offering real-time collaboration capabilities for cross-functional teams.
The Process Family Matrix helps you group similar processes together, making your VSM efforts more targeted and efficient. This matrix categorizes processes based on shared characteristics, helping you identify non value added activities that might be systemic across multiple product or service lines.
Integration with Complementary Methods
Combine your value stream mapping non value added activity identification with these proven techniques:
- Kaizen events focused specifically on eliminating identified non value added activities
- Time observation studies to quantify waste with precise measurements
- Spaghetti diagrams to visualize unnecessary movement and transportation waste
- Value analysis worksheets to calculate process efficiency ratios
- SIPOC (Supplier, Input, Process, Output, Customer) diagrams to establish clear boundaries
Statistical Process Control (SPC) provides quantitative validation of your improvements after eliminating non value added steps. This data-driven approach ensures your process changes actually deliver meaningful results rather than simply shifting problems elsewhere.
Digital mapping tools have revolutionized how you can track and analyze non value added activities. Modern software solutions offer features like:
- Real-time process simulation to test improvement scenarios
- Customizable templates for different industry applications
- Automatic calculation of process metrics
- Collaboration features for remote project teams
- Integration with other continuous improvement tools
The value stream mapping non value added identification process benefits from using visual management boards where all team members can see current state maps alongside improvement targets. This transparency helps maintain focus on eliminating the most impactful waste categories first.
When implementing these tools, remember that continuous improvement depends on accurately identifying which activities truly add value from the customer’s perspective. The tools themselves won’t eliminate waste – they simply make non value added activities visible so your team can take appropriate action.

Strategic Implementation and Benefits
When implementing value stream mapping non value added activities identification, you’ll discover significant improvements across your organization’s functions. Your cross-departmental teams will gain unprecedented visibility into processes that previously operated in silos. This visibility allows you to eliminate waste systematically while maintaining focus on customer-centric value creation.
Implementation Framework for Maximum Impact
You’ll achieve optimal results by following a structured implementation approach:
- Secure executive sponsorship to drive change across departments
- Form cross-functional teams with representatives from each process stage
- Establish clear metrics for identifying value stream mapping non value added activities
- Document both current and future state maps with detailed process steps
- Prioritize improvement opportunities based on impact and implementation effort
- Create detailed action plans for eliminating value stream mapping non value added waste
- Implement changes using the PDCA (Plan-Do-Check-Act) cycle
- Monitor results and adjust implementation strategies as needed
The benefits of properly implementing value stream mapping extend far beyond simple waste reduction. Your organization will experience enhanced process transparency that breaks down departmental barriers. By focusing on continuous improvement, you’ll create a culture that constantly questions process steps and seeks efficiency.
The data-driven nature of value stream mapping provides you with concrete metrics to track progress. Your teams will identify opportunities for reducing cycle times by eliminating value stream mapping non value added activities that often constitute 60-80% of total process time. This leads to faster delivery, lower costs, and improved customer satisfaction.
Value stream mapping also serves as an excellent collaboration tool for project teams. When employees from different functions work together to map processes, they develop shared understanding and ownership of improvement initiatives. This collaborative approach helps overcome resistance to change and builds momentum for transformation.
The versatility of value stream mapping makes it valuable across industries. Whether you operate in manufacturing, healthcare, financial services, or technology, the principles of identifying value stream mapping non value added activities remain consistent. Your ability to adapt this powerful tool to your specific context will determine its ultimate impact on organizational performance.