Creating a Flow Chart
Creating a flow chart starts with recognizing its value as a visual tool that maps complex business processes through standardized shapes and arrows. Breaking down workflows into sequential steps with appropriate symbols transforms operations into clear, actionable visual guides that boost understanding and process optimization.
Key Takeaways:
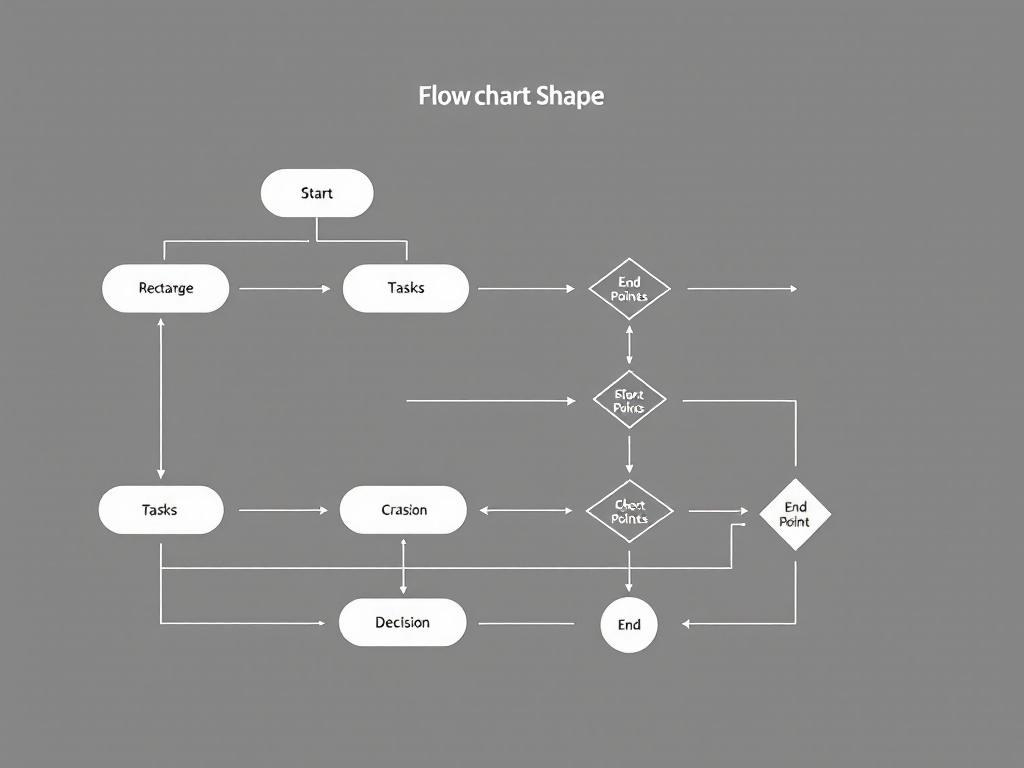
- Flowcharts use standardized symbols like ovals (start/end), rectangles (tasks), and diamonds (decisions) to represent process steps
- Choose the appropriate flowchart type based on your specific business objective, such as process flow, swimlane, or decision diagrams
- Involve stakeholders in the creation process to ensure accuracy and comprehensive process representation
- Maintain visual clarity by using consistent symbols, a subdued color palette, and logical flow direction
- Use annotations and consider design factors that support quick comprehension of complex workflows
Effective flowchart creation begins with defining your specific goal. Ask yourself what process you need to document or what problem you’re trying to solve. This clarity helps determine the scope and detail level needed.
Collect comprehensive information about each step in your process. Talk to team members who perform these tasks daily for accurate insights. Their practical experience often reveals nuances that formal documentation misses.
Selecting the right flowchart type makes a significant difference. Process flowcharts work well for sequential operations, while swimlane diagrams help clarify departmental responsibilities. Decision trees excel at mapping conditional paths based on different choices.
Draft your flowchart with standard symbols that follow industry conventions. Start with rough sketches before moving to digital tools. This approach allows quick revisions without getting caught in design details too early.
Modern flowchart software offers templates and drag-and-drop functionality that streamlines creation. Tools like Lucidchart, Microsoft Visio, and Draw.io provide collaboration features that let teams work together on complex diagrams.
Test your flowchart with users unfamiliar with the process. Their questions highlight areas that need clarification or refinement. This validation step confirms your diagram communicates effectively to its intended audience.
Remember to update your flowcharts as processes change. Outdated diagrams create confusion and undermine trust in documentation. Regular reviews keep these visual tools relevant and useful for ongoing process improvement.
“Transform complex business processes into actionable insights by leveraging flowcharts—a visual tool that clarifies workflows through standardized symbols. By involving stakeholders and ensuring visual clarity, organizations can enhance understanding and optimization, turning intricate operations into streamlined success.”
Creating Effective Flowcharts for Business Process Optimization
Flowcharts are powerful visual tools that map out processes, workflows, and decisions using standardized shapes and arrows. They make complex business operations easier to understand and optimize. The best way to create a flow chart starts with understanding its purpose – whether you’re documenting current processes or designing new ones.
You can use flowcharts to standardize procedures across departments and identify inefficiencies like bottlenecks or redundant tasks. By creating visual process maps, you’ll support cross-functional collaboration and improve communication across teams.
Different flowchart types serve various business needs:
- Process Flow Diagrams: Outline sequential steps in product design and management
- Swimlane Diagrams: Divide responsibilities by department, showing parallel workflows
- Value Stream Maps: Visualize entire value chains to identify automation opportunities
- Decision Flowcharts: Guide users through choice-based processes to logical conclusions
To create an effective flow chart, follow these key steps:
- Define the specific process and purpose
- Break it into sequential steps from trigger to endpoint
- Choose appropriate symbols (ovals for start/end, rectangles for tasks, diamonds for decisions)
- Select the right flowchart type based on your objective
- Involve stakeholders for accuracy
Design Considerations for Maximum Clarity
The best way to create a flow chart involves thoughtful design choices. Keep symbols simple and consistent with standard conventions. For complex multi-department flowcharts, use a subdued color palette to avoid visual confusion.
When designing your flowchart:
- Maintain clear start/end points and logical flow direction
- Include annotations to provide detail on key tasks
- Consider timeline integration for time-sensitive processes
- Experiment with different formats to find the best representation
Using the best way to create a flow chart helps you implement continuous improvement initiatives by providing a visual foundation for process analysis. The right flowchart can transform how your team understands workflows, making it easier to spot opportunities for optimization and standardization.
Expert Insight: To create effective flowcharts for business process optimization, start by clearly defining the process and its purpose, breaking it down into sequential steps and selecting the appropriate flowchart type. Use consistent symbols and a clear layout to enhance understanding, incorporating feedback from stakeholders to ensure accuracy. Lastly, embrace design considerations like color choices and annotations to maintain clarity, which will facilitate better communication and collaboration across teams.
Types of Flowcharts and Their Business Applications
Finding the best way to create a flow chart begins with understanding the different types available and their specific business uses. Flow charts visually map processes, workflows, and decisions using standardized shapes that make complex operations easier to analyze and optimize.
When selecting the right flowchart type, you need to match it with your specific business objective. Here are the main types and their applications:
Process Flow Diagrams and Cross-Functional Charts
Process Flow Diagrams excel at outlining sequential steps in product design and general business management. They help you visualize entire processes from beginning to end, making them ideal for identifying process dependencies and improvement opportunities.
Cross-Functional (Swimlane) Diagrams divide processes by department responsibilities, showing parallel workflows and clarifying who does what. These are particularly valuable when you need to:
- Track responsibilities across multiple teams
- Identify handoff points between departments
- Visualize how work flows between different business units
- Highlight communication requirements between groups
Value Stream Maps take process visualization further by capturing entire value streams, helping you:
- Identify automation opportunities
- Track lead and cycle times
- Eliminate waste in your processes
- Visualize the flow of materials and information
Decision Flowcharts guide users through choice-based processes until reaching logical conclusions. These charts are essential for documenting decision techniques and creating standardized response procedures.
System and Production Flowcharts illustrate how inputs are processed through systems or manufacturing processes. They’re invaluable for technical documentation and process standardization efforts.
To choose the best way to create a flow chart for your specific needs, consider both your audience and objective. For executive presentations, simpler high-level process flows often work best. For technical teams implementing detailed procedures, comprehensive flowcharts with decision points and exception handling may be necessary.
The best way to create a flow chart ultimately depends on selecting the appropriate type that matches your specific business process and visualization needs. By understanding the strengths of each flowchart type, you’ll be better equipped to select the best way to create a flow chart that communicates your process effectively and drives meaningful improvement.
Expert Insight: When creating flowcharts for business applications, start by understanding the strengths of different types—like Process Flow Diagrams for sequential steps and Cross-Functional Charts for departmental workflows. Tailor your choice to your audience and objective: use high-level visuals for executive updates and detailed charts for technical discussions. Ultimately, selecting the right flowchart type enhances clarity, fosters collaboration, and drives process improvements effectively.
Step-by-Step Approach to Creating Effective Flowcharts
Creating the best way to create a flow chart starts with understanding what they are – visual representations that map out processes, workflows, and decisions using standardized shapes and arrows. You’ll find flowcharts extremely valuable for making complex business operations easier to understand and optimize.
Before diving into creation, you need to identify the specific process you want to document. Define a single workflow with clear boundaries to avoid unnecessary complexity. Your flowchart should have a distinct purpose, whether it’s improving efficiency, training new staff, or enhancing project collaboration.
Break your process into sequential steps by listing all actions, decisions, and inputs/outputs from trigger to endpoint. This methodical approach ensures you don’t miss critical components when building your flowchart. The best way to create a flow chart involves careful consideration of each step’s relationship to others.
Choosing the Right Symbols and Format
Select appropriate symbols that follow standard conventions:
- Ovals for start/end points
- Rectangles for tasks or actions
- Diamonds for decision points
- Arrows to show direction of flow
- Parallelograms for inputs/outputs
The best way to create a flow chart includes selecting the right type based on your objective:
- Process Flow Diagrams: Ideal for sequential steps
- Cross-Functional/Swimlane Diagrams: Show departmental responsibilities
- Value Stream Maps: Identify automation opportunities
- Decision Flowcharts: Guide users through choice-based processes
- System Flowcharts: Illustrate how inputs are processed
Involve stakeholders through interviews or direct observation to ensure accuracy. Their input is valuable for developing risk response strategies and identifying potential bottlenecks in the process.
For complex multi-department flowcharts, use a subdued color palette to prevent visual confusion. Maintain a clear visual hierarchy with distinct start/end points and logical flow direction. The best way to create a flow chart includes thoughtful design that supports quick comprehension.
Consider these design factors to maximize clarity:
- Keep symbols consistent throughout
- Add annotations for complex tasks
- Include a legend for special symbols
- Use straight lines and 90-degree angles when possible
- Limit the number of crossing lines
Remember that the best way to create a flow chart results in a document that standardizes procedures across departments while identifying inefficiencies like bottlenecks or duplicate tasks.
Visual representations like flowcharts can increase understanding by 400%, making complex processes easier to digest and optimize.
hbr.org
Design Considerations for Maximum Clarity
When creating flowcharts, visual clarity is essential for the best way to create a flow chart that effectively communicates your process. You’ll need to balance simplicity with information density to ensure your flowchart remains accessible while providing sufficient detail.
Keep symbols consistent and simple by following standard conventions. Use ovals for start/end points, rectangles for process steps, diamonds for decisions, and arrows for flow direction. This standardization ensures anyone familiar with basic flowcharting can understand your diagram without additional explanation.
For complex processes involving multiple departments, implement a subdued color palette. Assign a specific color to each department or function, but avoid bright, clashing colors that create visual confusion. This subtle color-coding enhances project collaboration while maintaining a professional appearance.
Maintaining visual hierarchy helps readers follow the best way to create a flow chart properly. Consider these techniques:
- Position start points at the top or left side of your diagram
- Use consistent spacing between elements
- Make decision points visually distinct from process steps
- Ensure arrow directions clearly indicate process flow
- Group related activities visually when possible
Include annotations where necessary to provide additional context. For steps requiring detailed explanations, add brief notes rather than cramming information inside flowchart shapes. This approach keeps your diagram clean while providing necessary details.
Format Considerations
The format of your flowchart significantly impacts its effectiveness. For complex processes, consider using:
- Swimlane diagrams to clearly delineate responsibilities
- Vertical layouts for sequential processes
- Horizontal layouts for processes with many parallel activities
- Hierarchical structures for processes with multiple sub-processes
Timeline integration can be valuable for processes with specific scheduling requirements. Adding time estimates to process steps helps identify dependencies and constraints that might impact implementation.
Experiment with different formats before finalizing your flowchart. What works best for one process may not be optimal for another. The best way to create a flow chart ultimately depends on your specific process and audience needs.
Visual clarity is paramount; 70% of people are more likely to understand a process when it’s presented visually compared to text alone.
hbr.org