Creating Data Flow Diagrams (DFDs)
Data Flow Diagrams (DFDs) provide powerful visual representations that map data interactions within business systems, transforming how organizations understand and optimize their information pathways. By using standardized symbols and structured mapping techniques, businesses can gain clarity into data movement, process transformations, and system interactions.
Key Takeaways
- DFDs offer a comprehensive visual language for tracking data movement across organizational systems.
- Four core components (processes, data stores, external entities, and data flows) enable detailed system mapping.
- Diagrams help identify process bottlenecks and optimize workflow efficiency.
- Create DFDs to enhance cross-team communication and reduce implementation errors.
- Standardized documentation supports continuous improvement and strategic planning initiatives.
DFDs serve as essential tools for mapping information flow within organizations. You’ll find these diagrams particularly useful when analyzing complex systems where understanding data pathways becomes critical for efficiency improvements.
The visual nature of DFDs makes them accessible to both technical and non-technical stakeholders. This accessibility fosters better collaboration between departments and ensures everyone shares the same understanding of system operations.
Creating effective DFDs requires attention to detail and adherence to standard notation practices. You can start with high-level context diagrams before breaking down processes into more detailed representations.
Many organizations integrate DFDs into their system development lifecycle to document requirements, identify potential issues early, and create a baseline for future improvements. This proactive approach reduces development costs and improves system quality over time.
“Data Flow Diagrams (DFDs) are transformative tools that illuminate the intricate pathways of data within an organization, fostering a deeper understanding and optimization of information systems. By employing standardized symbols and structured mapping, DFDs not only enhance communication and efficiency but also empower businesses to strategically navigate their data landscape.”
What Are Data Flow Diagrams?
Data Flow Diagrams (DFDs) are visual representations that show how data moves through business systems. These powerful tools help you map complex processes and data interactions using standardized symbols. You’ll find them invaluable when trying to create data flow diagram representations that capture your organization’s information pathways.
DFDs use specific symbols to represent different system components, making it easier to understand data movement at a glance. They’re particularly useful for optimizing workflows and documenting system architecture. When you create data flow diagram models, you’ll gain clarity about how information travels between different parts of your business.
Core Components of Data Flow Diagrams
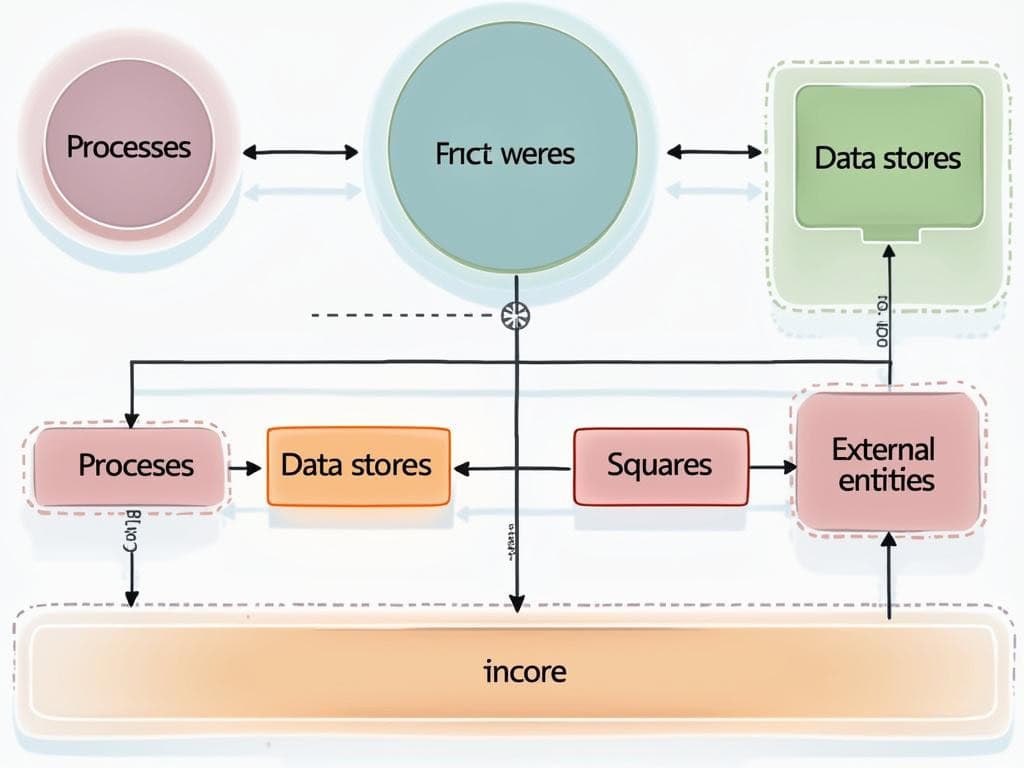
To create data flow diagram models effectively, you need to understand the four essential elements:
- Processes – These transformation points show where data is modified or processed:
- Represented by circles or rounded rectangles
- Show functions like validation, enrichment, and synchronization
- Labeled with clear, action-oriented names
- Data Stores – Locations where information is held at rest:
- Shown as open-ended rectangles or parallel lines
- Include databases, data warehouses, and filing systems
- Named using plural nouns for clarity
- External Entities – Systems or users outside the primary process:
- Depicted as rectangles
- Represent input/output sources like mobile apps or payment gateways
- Show boundaries of your system
- Data Flows – Directional arrows showing data movement:
- Each labeled with specific data type/name
- Indicate the path information takes between components
- Create data flow diagram connections that link all elements
The process to create data flow diagram models follows a structured approach. You’ll start by defining system scope, identifying main processes, mapping external entities, and tracing data movement. Creating hierarchical levels (from context diagrams to detailed models) helps manage complexity.
When you implement DFDs, you’ll experience numerous benefits including enhanced team collaboration, identification of process bottlenecks, and standardized documentation. They’re particularly valuable during strategic planning initiatives.
Using specialized diagramming tools makes it easier to create data flow diagram representations that can be shared across departments. This shared visual language helps eliminate misunderstandings and potential implementation errors while supporting continuous improvement initiatives.
DFDs serve multiple practical applications including project planning, compliance documentation, and operational transparency. By learning to create data flow diagram models for your organization, you’ll gain powerful insights that drive better decision-making and system optimization.

Core Components of Data Flow Diagrams
To create a data flow diagram effectively, you need to understand its fundamental components. Data flow diagrams (DFDs) serve as visual tools that map how information moves through your business systems. When properly implemented, these diagrams offer clarity and structure to complex data interactions within your organization.
Processes: The Transformation Points
Processes represent the areas where data undergoes transformation or modification. You’ll typically identify these using circles or rounded rectangles in your diagram. When you create data flow diagram elements for processes, use action-oriented names that clearly describe the function being performed. These components handle operations like:
- Data validation and verification
- Information enrichment and enhancement
- Data synchronization between systems
- Calculations and analytical processing
- Filtering and sorting operations
Data stores function as repositories where information rests between processes. You’ll represent these using open-ended rectangles or parallel lines when you create data flow diagram components. These include databases, filing systems, and data warehouses. For clarity, always name your data stores using plural nouns (e.g., “Customer Records”).
External entities appear as rectangles in your diagram and represent systems or users outside your primary process boundary. These might include payment gateways, mobile applications, or user interfaces. When you create data flow diagram connections, use directional arrows to show information movement between components, labeling each with the specific data being transferred.
Data flows themselves are depicted as arrows showing the direction and path of information movement throughout the system. Each flow must be clearly labeled with the specific type of data being transmitted. This level of detail helps identify key stakeholders who interact with your systems.
Creating effective data flow diagrams delivers several business benefits. They enhance cross-team communication by providing a standardized visual language everyone can understand. You’ll identify process bottlenecks more easily and facilitate workflow optimization efforts. DFDs also create reliable system documentation, reducing misunderstandings during implementation phases.
When you create data flow diagram hierarchies, you’ll typically work through multiple levels of detail. Begin with a context diagram (Level 0) showing the system’s overall boundaries, then progress to more detailed representations in Levels 1 and 2. This approach helps manage complexity while maintaining comprehensiveness.
For best results, follow a structured creation process: define your system scope, identify main processes, map external entities, trace data movement, and validate with stakeholders. Using specialized diagramming tools will streamline this process and ensure consistency in your documentation. Integrating DFDs with your continuous improvement initiatives maximizes their value as both planning and optimization tools.
Expert Insight: To create effective data flow diagrams (DFDs), focus on understanding and clearly representing its core components: processes, data stores, external entities, and data flows. Ensure that processes are action-oriented and distinctly named, data stores are labeled using plural nouns for clarity, and data flows are accurately represented with directional arrows and precise labels. Following a structured creation process and utilizing diagramming tools can significantly enhance communication, identify bottlenecks, and facilitate comprehensive documentation within your organization.
Data Storage and External Interactions
Data stores and external entities serve as critical components when you create data flow diagram models for your business. Understanding these elements helps you effectively map your information systems and optimize data management processes.
Data Stores: Where Information Resides
Data stores represent repositories where information sits at rest within your system. When you create data flow diagram notation for data stores, you’ll typically use open-ended rectangles or parallel lines with appropriate labels. These stores maintain data that processes can access when needed without requiring immediate action.
Common examples of data stores include:
- Relational databases storing structured information
- Document management systems holding unstructured content
- Data warehouses aggregating enterprise information
- Physical filing systems containing paper documents
- Cloud storage solutions hosting shared resources
When naming data stores, use plural nouns that clearly identify the information type they contain. For instance, “Customer Records” or “Transaction Logs” provides immediate clarity about the stored data type when you create data flow diagram elements.
Data stores interact with your processes through input and output flows. As effective project communication demands, each connection should be labeled with specific data types moving to or from the store.
External Entities: The Outside Interactions
External entities exist outside your system boundaries but interact with your processes. These entities, represented by rectangles in your diagram, serve as sources or destinations for data. Examples include:
- Customers submitting orders
- Vendors providing inventory updates
- Payment gateways processing transactions
- Third-party verification services
- Mobile applications interfacing with your system
Each external entity must connect to at least one process via data flows. These connections show how your system interfaces with the outside world. When you create data flow diagram models with well-defined external entities, you establish clear system boundaries and interaction points.
The relationship between data stores and external entities forms the foundation of your information ecosystem. By carefully mapping these elements when you create data flow diagram models, you’ll gain valuable insights into potential project roadblocks and optimization opportunities.
Remember that data flows between these components should be represented by labeled arrows indicating both direction and content. Each flow should specify exactly what information moves between components, helping stakeholders understand the complete data lifecycle within your organization.
By thoroughly documenting data storage and external interactions, you create a comprehensive blueprint of your system’s information architecture that supports strategic decision-making and process improvement initiatives.
Expert Insight: To optimize your data management processes, ensure that your data flow diagrams clearly represent data stores and external entities. Use distinct, plural nouns for data store labels, such as “Customer Records,” to convey immediate clarity about the stored information. Additionally, accurately depict data flows with labeled arrows, indicating the direction and type of information exchanged between components, to enhance stakeholder understanding of your information ecosystem.
External Entities and Data Flows
External entities are critical components when you create data flow diagram models. These elements represent systems, people, organizations, or departments that exist outside the boundaries of your primary process. You’ll typically show these as rectangles in your diagrams, making them easily distinguishable from other components.
These external elements serve as either sources or destinations for data in your system. They might include customer interfaces, third-party systems, payment gateways, mobile applications, or even physical departments within your organization. When working with project collaboration teams, identifying these entities clearly helps everyone understand system boundaries.
Data flows connect these external entities to your internal processes through directional arrows. Each arrow represents how information moves between components. For effective diagrams, label each flow with the specific data type or name being transferred. For example, “Customer Information,” “Payment Details,” or “Inventory Status.”
When mapping these flows, consider these essential characteristics:
- Direction of data movement (indicated by arrow orientation)
- Specific data elements being transferred
- Timing or frequency of data exchange
- Format or structure of the data
- Security considerations for sensitive data
Remember that creating accurate data flow connections is vital for identifying project stakeholders who interact with your system. External entities often represent key stakeholders whose needs must be addressed.
Best Practices for Mapping External Interactions
To create data flow diagram representations that accurately capture external interactions, follow these proven techniques:
- Name entities with specific nouns (e.g., “Payment Processor” rather than “Process Payments”)
- Maintain consistent entity names across all diagram levels
- Limit connections to show only relevant data exchanges
- Use different arrow styles to indicate different types of data flows
- Document any assumptions about external system behaviors
This structured approach helps prevent scope creep and ensures your diagrams remain focused on essential interactions. By mapping external entities and data flows carefully, you’ll create a foundation for project disaster recovery planning and system optimization.
The table below summarizes common external entity types and their typical data flow patterns:
| Entity Type | Example | Typical Data Flows |
|---|---|---|
| User Interfaces | Mobile Apps, Web Portals | User inputs, Display data, Notifications |
| External Systems | Payment Gateways, CRM Systems | API calls, Batch transfers, Real-time feeds |
| Physical Departments | Accounting, Warehouse | Reports, Status updates, Authorizations |
| Regulatory Bodies | Tax Authorities, Compliance Agencies | Compliance data, Regulatory reports |
By mastering the representation of external entities and data flows, you’ll create data flow diagram models that accurately represent your system’s boundaries and interactions, providing valuable insights for process improvement.
Organizations that effectively map their data flows and external interactions can reduce project risks by up to 50%.
forbes.com
Benefits for Business Process Management
Data flow diagrams (DFDs) deliver significant advantages for organizations looking to improve their operations. When you create data flow diagram representations of your systems, you’re investing in tools that enhance business process management in multiple ways.
DFDs provide exceptional clarity for cross-functional teams by creating a universal visual language everyone can understand. Technical and non-technical stakeholders can use these diagrams to communicate effectively about complex data systems without misinterpretation. This shared understanding helps bridge communication gaps between IT teams and business units during system development or modification.
Key Business Advantages of Data Flow Diagrams
You’ll gain several critical benefits when implementing DFDs in your organization:
- Process Bottleneck Identification: DFDs clearly highlight where data congestion occurs, making it easier to pinpoint inefficiencies that slow operations.
- Workflow Optimization Opportunities: By visualizing all data paths, you can identify redundant processes or unnecessary steps to streamline operations.
- Standardized Documentation: DFDs create consistent system documentation that remains valuable for future modifications and onboarding.
- Error Reduction: Clear visualization reduces misunderstandings that could lead to implementation errors.
- Gap Analysis: Diagrams reveal missing data connections or overlooked interactions between system components.
Data flow diagrams also support continuous improvement initiatives by providing baseline documentation against which you can measure process enhancements. When integrated with project portfolio management practices, DFDs help prioritize technology investments by visualizing which systems handle the most critical data flows.
| Stakeholder Group | Key Benefits When You Create Data Flow Diagram |
|---|---|
| IT Teams | Technical specifications for development; system architecture documentation |
| Business Analysts | Process improvement opportunities; requirements validation |
| Project Managers | Scope visualization; impact assessment for changes |
| Executive Leadership | High-level system understanding; strategic decision support |
| Compliance Officers | Data handling documentation; audit trail support |
DFDs particularly excel at supporting project collaboration by providing a neutral reference point during cross-functional discussions. Instead of relying on complex technical descriptions, teams can create data flow diagram visualizations that make complex interactions instantly understandable to everyone involved in process improvement initiatives.
Step-by-Step DFD Creation Process
Creating a data flow diagram doesn’t need to be complicated when you follow a structured approach. Data flow diagrams help visualize how information moves through your organization’s systems, making complex processes easier to understand and optimize.
Define System Boundaries and Gather Information
Begin by clearly establishing what you’re mapping. You’ll need to:
- Identify the system’s scope and boundaries
- Gather requirements from stakeholders
- Document existing processes through interviews
- Collect sample documents and reports
- Understand data inputs and outputs
Once you’ve collected this information, you’re ready to create data flow diagram components. Each element plays a crucial role in representing how data moves throughout your system.
To successfully create data flow diagram elements, follow these essential steps:
- Map external entities (rectangles) that interact with your system
- Identify processes (circles/rounded rectangles) where data transformation occurs
- Document data stores (parallel lines) where information rests
- Draw data flows (arrows) showing movement between components
- Label each component with precise, descriptive names
Using specialized diagramming tools can make this process more efficient. Software options like Lucidchart, Microsoft Visio, or Draw.io provide templates and symbols specifically designed to create data flow diagrams.
When you select appropriate project management tools, you’ll simplify the creation process and maintain consistency across your documentation.
Creating multiple diagram levels adds clarity to complex systems:
| Level | Purpose | Detail Level | Primary Audience |
|---|---|---|---|
| 0 (Context) | Overview of entire system | Minimal | Executives, stakeholders |
| 1 (Process) | Main processes and data stores | Moderate | Project managers, analysts |
| 2 (Detailed) | Complete system breakdown | Comprehensive | Developers, implementers |
After drafting your diagram, validate it with stakeholders to ensure accuracy. This collaborative approach helps strengthen project collaboration and ensures the diagram accurately represents current or planned processes.
Remember to maintain proper notation consistency throughout your documentation. Following standard Yourdon, Gane & Sarson, or SSADM conventions ensures your diagrams remain understandable to others familiar with data flow diagrams.
By following these steps to create data flow diagram representations, you’ll develop a powerful visual tool that enhances communication, identifies inefficiencies, and supports process improvements across your organization.
Practical Applications and Next Steps
You’ll find numerous practical ways to create data flow diagrams and integrate them into your business operations. These visual tools aren’t just documentation—they’re powerful assets for organizational improvement.
DFDs serve as essential components when planning new projects. Before writing a single line of code, you can create data flow diagram models to visualize how information will move through your proposed system. This helps identify potential issues early, saving costly rework later.
Key Implementation Areas
When facing regulatory requirements, DFDs provide clear documentation of how sensitive data travels through your systems. Financial services and healthcare organizations particularly benefit from this transparency for compliance purposes.
Here’s how you can incorporate DFDs into various business processes:
- Integrate with existing continuous improvement frameworks like Six Sigma or Lean
- Apply to legacy system analysis before modernization projects
- Use in data security assessments to identify vulnerable points
- Employ during merger/acquisition technical due diligence
- Incorporate into system requirement specifications
The next crucial step after creating a DFD is effective project communication with stakeholders. Your diagrams need interpretation—train your teams to understand what the symbols represent and how to extract actionable insights.
Modern DFD creation tools have transformed the process from manual drafting to sophisticated digital modeling. Software options range from general diagramming tools to specialized business process modeling suites that can create data flow diagram representations with validation features.
To maximize the strategic value of your DFDs, connect them to broader strategic planning efforts. The transparency they provide enables more informed decision-making about technology investments, process changes, and resource allocation.
Organizations that regularly update and reference their DFDs maintain better operational awareness. By treating these diagrams as living documents rather than one-time deliverables, you’ll create an environment where process understanding becomes embedded in your culture.
When implementing a new system, use DFDs to create data flow diagram validation checkpoints throughout the development lifecycle. This ensures the final implementation matches the intended design, reducing the risk of functionality gaps that can derail projects.