Understanding Operations Flow Charts
Operations flow charts transform complex business processes into clear, visual roadmaps that enable organizations to optimize workflows and boost operational efficiency. By using standardized symbols like rectangles for tasks and diamonds for decisions, these charts provide an intuitive, comprehensive view of how work moves through an organization, making process improvements more accessible and actionable.
Key Takeaways:
- Operations flow charts visually map business processes using standardized symbols to improve understanding and efficiency.
- These charts help identify bottlenecks, redundancies, and optimization opportunities across different organizational functions.
- Effective flow charts can reduce process errors by 20-30% and enhance cross-departmental communication.
- Different types of flow charts exist, including basic, swimlane, and cross-functional diagrams, each suited to specific business needs.
- Creating powerful flow charts requires gathering stakeholder input, applying consistent symbols, and regularly reviewing and refining the documentation.
The Importance of Flow Charts
Flow charts serve as essential process visualization tools for businesses of all sizes. They break down complicated operations into digestible, sequential steps that everyone can understand. This visual approach lets you spot inefficiencies quickly and communicate processes across departments without confusion.
The value of operational flow charts extends beyond simple documentation. They create a shared understanding that cuts training time and reduces costly mistakes. Your team gains clarity on their responsibilities and how their work connects to broader company goals.
Different Flow Chart Types
Different flow chart types serve various business needs:
- Basic flow charts work well for straightforward processes.
- Swimlane diagrams assign responsibilities to specific departments.
- Cross-functional charts map interactions between teams.
Choose the format that matches your specific process complexity and audience needs.
Creating Effective Flow Charts
Creating effective flow charts starts with thorough process research. Gather input from actual process participants to ensure accuracy. Use consistent symbols throughout your documentation to maintain clarity. Keep your charts updated as processes change – outdated documentation causes more problems than it solves.
Modern flowchart software offers advantages over traditional drawing methods. Digital tools provide symbol libraries, collaboration features, and easy updating capabilities. This approach ensures your flow charts remain accurate as your business evolves.
Balancing Simplicity and Completeness
The best flow charts balance simplicity with completeness. Include enough detail to guide users without overwhelming them with excessive information. Focus on the critical path while providing clear direction for exceptions and decision points.
Implementation and Training
Implementation requires proper distribution and training. Ensure everyone who needs access to these visual guides can find them easily. Train team members on how to interpret the symbols and follow the documented paths. Consider creating interactive digital versions for complex processes.
Maintaining Flow Chart Accuracy
Regular review cycles maintain flow chart accuracy. Schedule quarterly checks to verify that documented processes still match actual operations. This practice prevents the business process models from becoming obsolete as your organization grows and changes.
Benefits During Onboarding
Flow charts prove particularly valuable during onboarding and cross-training initiatives. New employees grasp their responsibilities faster when presented with visual process maps rather than text-heavy manuals. This visual approach cuts training costs while improving knowledge retention.
“Operations flow charts illuminate the intricate pathways of business processes, transforming complexity into clarity and enabling organizations to optimize efficiency. By harnessing standardized symbols, these visual roadmaps empower teams to identify bottlenecks, streamline workflows, and enhance communication across departments.”
What Are Operations Flow Charts?
Operations flow charts are visual tools that map out business processes in a sequential, easy-to-understand format. They transform complex workflows into clear, logical steps using standardized symbols and connecting lines. An operations flow chart displays the complete journey of a process from beginning to end, making it invaluable for optimization efforts.
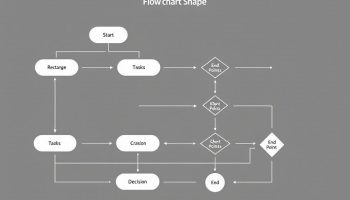
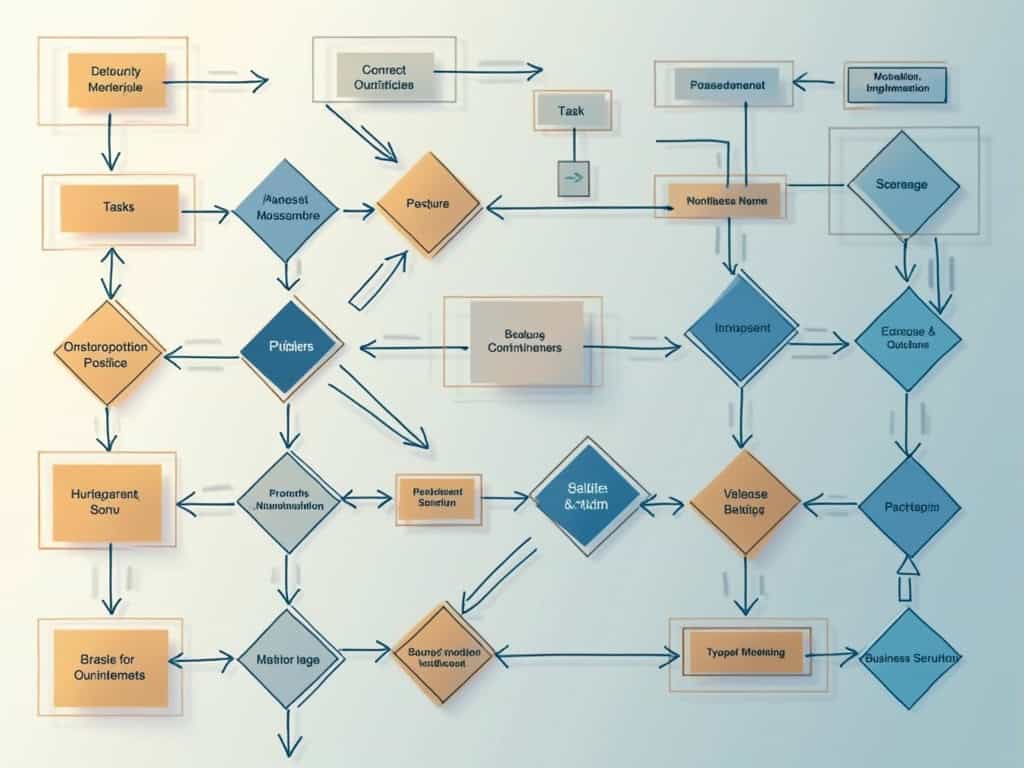
Your business processes become transparent when properly documented in flow charts. Each operations flow chart uses distinct symbols—rectangles for tasks, diamonds for decisions, and arrows showing direction of flow—to create a comprehensive picture of how work moves through your organization.
The primary purpose of an operations flow chart is to improve process understanding and efficiency. By mapping your processes visually, you can quickly identify bottlenecks, redundancies, and improvement opportunities that might otherwise remain hidden in text-based documentation.
Operations flow charts serve multiple functions in business settings:
- Documenting existing processes for training and standardization
- Analyzing workflows to identify inefficiencies and optimization opportunities
- Supporting continuous improvement initiatives like Six Sigma or Lean
- Facilitating communication between teams about shared processes
- Providing clear visual guidance for new employees
When implemented effectively, operations flow charts become essential tools for process improvement systems. They enable you to see the big picture while also focusing on specific operational details that impact performance.
Core Components of Effective Flow Charts
To create powerful operations flow charts, you need to understand their essential components:
- Start and end points clearly marked with oval or rounded rectangle symbols
- Process steps represented by rectangles containing concise action statements
- Decision points shown as diamonds with yes/no or true/false paths
- Connector arrows indicating the direction of process flow
- Input/output symbols showing where data or materials enter or exit the process
The table below outlines common symbols used in operations flow charts and their meanings:
| Symbol | Name | Purpose |
|---|---|---|
| Oval | Terminal | Marks start and end points |
| Rectangle | Process | Represents an action or task |
| Diamond | Decision | Shows a question requiring a response that branches the flow |
| Arrow | Flow Line | Indicates direction between steps |
| Parallelogram | Input/Output | Shows data entry or output points |
| Circle | Connector | Links to another part of the flow chart |
By consistently using these standardized symbols, you create operations flow charts that anyone in your organization can understand and follow. This standardized operating procedure flow chart approach ensures clarity and precision in process documentation.
Organizations that document their processes through flowcharts can achieve up to a 50% reduction in errors and improve overall process efficiency.
hbr.org
Core Components of Effective Flow Charts
Every powerful operations flow chart consists of several essential elements that transform complex processes into clear, actionable steps. These components work together to create a visual roadmap that improves operational efficiency and communication across your organization.
The foundation of any effective operations flow chart begins with standardized symbols that instantly communicate meaning. Rectangle shapes represent tasks or activities that need completion, while diamond shapes indicate decision points requiring yes/no answers. Arrows connect these elements and show the direction of process flow. These symbols create a universal visual language that helps team members quickly understand complex workflows.
Proper flow charts always include clearly marked start and end points that define process boundaries. Without these markers, your operations flow chart may leave users confused about where processes begin and terminate. You’ll find this particularly important when integrating multiple operational processes that need to connect seamlessly.
Decision points represent critical junctures in your operations flow chart where different paths emerge based on specific conditions. These branching points illustrate alternative process routes and help teams understand how to handle various scenarios. When creating your operations flow chart, focus on capturing all potential decision outcomes to prevent confusion during implementation.
Advanced Flow Chart Elements
Beyond basic symbols, sophisticated operations flow charts incorporate additional elements that enhance their utility. Input and output indicators show where resources enter and exit the process, while connectors link related processes across different charts or pages. These connections help maintain the continuity of your operations flow chart across complex business functions.
Swimlanes represent one of the most valuable features in cross-functional operations flow charts. These horizontal or vertical divisions assign process steps to specific departments, teams, or individuals, making responsibilities immediately clear. Effective process communication improves when everyone can visualize exactly where their responsibilities begin and end.
Annotations and supplementary notes provide essential context that may not fit within the standard operations flow chart structure. These might include time estimates, resource requirements, or regulatory considerations that affect process execution. When managing complex operations, these details help teams understand not just what to do, but how to optimize their approach.
The most effective operations flow charts maintain a consistent level of detail throughout the document. Too much detail creates cluttered diagrams that overwhelm users, while too little leaves critical gaps in understanding. Your operations flow chart should strike a balance that provides sufficient information without unnecessary complexity.
Expert Insight: To create an effective flow chart, start with standardized symbols that communicate tasks and decisions clearly, using rectangles for tasks and diamonds for decision points. Ensure your chart includes well-defined start and end points to clarify process boundaries and maintain user understanding, especially when integrating multiple operational processes. Additionally, consider incorporating advanced elements like swimlanes to clarify responsibilities and annotations for context, ensuring that the chart remains informative without becoming overly complex.
Types of Operations Flow Charts
Operations flow charts serve as the backbone of process optimization efforts across industries. These visual representations break down complex workflows into digestible steps, making them easier to analyze and improve. You’ll find various types of operations flow charts suited for different business needs and scenarios.
Primary Operations Flow Chart Categories
Basic flowcharts provide a linear representation of process steps. They’re the simplest form of operations flow chart, using standard symbols to illustrate a sequence of activities from start to finish. You can quickly identify bottlenecks and redundancies with these straightforward diagrams, making them ideal for initial process analysis.
Swimlane diagrams take process visualization a step further by allocating tasks across departments or roles. This type of operations flow chart clearly delineates responsibilities and handoffs between team members or functional areas. When implementing effective project collaboration, swimlane diagrams help eliminate confusion about who handles what.
Cross-functional flowcharts excel at illustrating interdepartmental workflows. They map how processes move across organizational boundaries, highlighting dependencies and interaction points. This type of operations flow chart proves invaluable when tackling complex processes that span multiple teams or divisions, helping to streamline project management processes.
Specialized operations flow charts address specific business scenarios. These include:
- Onboarding process charts that streamline employee integration
- Contract approval diagrams that track document progression
- Document management flowcharts that visualize information lifecycle
- Incident response maps that guide crisis management procedures
The right operations flow chart depends on your specific needs. For complex projects requiring precise task allocation, consider using standard operating procedure flow charts. When managing operations across departments, cross-functional diagrams provide the clearest picture of process interactions.
Operations flow charts deliver tangible benefits when properly implemented. They typically reduce process errors by 20-30% through improved visibility and standardization. You’ll notice enhanced cross-departmental communication as team members gain a shared understanding of workflows. These visual tools also support automation initiatives by clearly defining process logic and decision points.
To maximize the impact of your operations flow chart, choose the appropriate type for your specific challenge and ensure it captures the right level of detail. A well-designed operations flow chart transforms complex processes into manageable, optimizable sequences that drive operational excellence.
Expert Insight: When creating operations flow charts, select the type that best suits your business challenge: basic flowcharts for straightforward processes, swimlane diagrams for clear role delineation, and cross-functional charts to illustrate interdepartmental interactions. Tailoring your chart to the specific needs of your workflow enhances visibility, reduces errors, and fosters collaboration among team members. Remember, a well-crafted flow chart not only simplifies complex processes but also lays the groundwork for continuous improvement and operational excellence.
Creating Powerful Flow Charts: A Step-by-Step Approach
An operations flow chart serves as your visual roadmap for business processes, turning complex workflows into clear, easy-to-follow sequences. You’ll find these diagrams invaluable for spotting inefficiencies and communicating processes across teams. Creating effective operations flow charts requires a systematic approach to capture all essential elements.
Here’s how you can develop powerful operations flow charts that transform your business processes:
- Identify the target process – Select a specific workflow that needs documentation or improvement. Focus on processes with high impact, frequent errors, or those undergoing change.
- Define precise boundaries – Establish clear start and end points to keep your operations flow chart focused and manageable. This prevents scope creep in your documentation efforts.
- Gather stakeholder input – Consult with team members who perform the process daily. Their insights will help you create an operations flow chart that reflects actual practices rather than assumed workflows.
- Map the sequence logically – Arrange steps in chronological order, ensuring each task connects logically to the next. Your operations flow chart should reflect the true process flow rather than an idealized version.
- Apply standard symbols – Use rectangles for tasks, diamonds for decisions, and arrows for flow direction. Consistent symbolism makes your operations flow chart instantly recognizable and universally understood.
- Review and refine – Test your operations flow chart with actual users to verify accuracy. Continuous improvement is essential for keeping flow charts relevant.
Selecting the Right Tools for Flow Chart Creation
The software you choose significantly impacts your ability to develop and maintain effective operations flow charts:
- Microsoft Visio: Offers comprehensive flowcharting capabilities with extensive symbol libraries
- Lucidchart: Cloud-based with excellent collaboration features
- Draw.io: Free alternative with solid functionality
- Specialized tools: Project management flow chart Excel templates for basic needs
When selecting a tool, consider these factors:
- Collaboration requirements (multi-user editing)
- Integration with existing systems
- Learning curve for your team
- Budget constraints
- Revision management capabilities
The right operations flow chart can reduce process errors by 20-30% while enhancing cross-departmental communication. They’re particularly valuable when implementing standard operating procedure flow charts that ensure consistency across your organization.
Remember that effective operations flow charts evolve with your business. Schedule regular reviews to ensure they continue to reflect current processes and support your efficiency goals. With careful development and maintenance, your operations flow charts will become an indispensable tool for operational excellence.
Effective flow charts can lead to a 20-30% reduction in process errors across departments, enhancing overall communication and efficiency.
www.forbes.com
Technology and Tools for Flow Chart Development
Creating effective operations flow charts requires the right tools. Your choice of software can significantly impact how easily you develop, share, and maintain these critical process diagrams. Modern flow chart tools offer features that transform complex operational processes into clear visual representations.
Microsoft Visio remains a powerhouse for professional operations flow chart development. It provides extensive template libraries and precise control over diagram elements. Visio’s integration with other Microsoft products allows you to connect your operations flow charts directly to data sources for dynamic visualizations.
Lucidchart offers cloud-based collaboration that’s particularly valuable for cross-functional teams working on process improvement. You can easily share your operations flow charts with stakeholders and collect real-time feedback. Its intuitive interface makes it accessible for both beginners and advanced users developing complex process maps.
For teams seeking a free alternative, Draw.io delivers robust functionality without cost barriers. This web-based tool supports collaborative editing and integrates with Google Workspace and Microsoft Office, making it easy to incorporate operations flow charts into existing documentation.
The following tools offer specialized features for process optimization:
- Tallyfy: Focuses on process execution and tracking beyond visualization
- Atlassian tools: Integrate directly with project management systems
- Visual Paradigm: Provides advanced business process modeling capabilities
When selecting a tool for operations flow chart development, consider these key factors:
- Collaboration capabilities
- Integration with existing systems
- Ease of use for your team
- Available templates and symbol libraries
- Version control features
The right technology empowers you to create operations flow charts that drive genuine process improvements. Your choice should align with operations improvement goals and team capabilities. Most platforms now offer free trials, allowing you to test before committing to a specific solution.
Implementation Considerations
When implementing new flow chart software, plan for proper user training. Even the most intuitive tools require some orientation to use effectively. Establish clear naming conventions and storage protocols for your operations flow charts to maintain organizational consistency.
Consider integration requirements carefully. Your operations flow chart tool should connect with project management software and other business systems to maximize value. Some organizations benefit from tools that enable direct process execution, while others primarily need visualization capabilities.
For complex process environments, look for tools supporting dynamic operations flow charts that can adapt to changing conditions or user inputs. This functionality helps teams understand conditional process paths and decision points more clearly.
Strategic Benefits and Implementation
Operations flow charts deliver tangible results across organizations of all sizes. You’ll see a 20-30% reduction in process errors when implementing these visual tools effectively. By mapping out each step in your operations visually, you can identify redundancies and bottlenecks that often remain hidden in text-based documentation.
An operations flow chart provides clarity that transforms how teams collaborate. When departments can literally see how their work impacts others, silos break down naturally. This visual representation helps everyone understand their role in the broader operational context, enhancing cross-functional coordination and reducing misunderstandings that lead to costly delays.
Key Implementation Strategies
To maximize the benefits of operations flow charts, consider these implementation approaches:
- Start with high-impact processes that affect multiple departments
- Engage frontline staff in flowchart development to capture practical insights
- Use consistent symbols and formatting across all company flowcharts
- Schedule regular reviews to keep diagrams updated as processes evolve
- Integrate flowcharts into training materials for new employees
- Link flowcharts to relevant documentation and resources
Operations flow charts serve as the foundation for process automation initiatives. By clearly mapping current workflows, you can more easily identify which steps could benefit from automation. This process improvement system approach helps prioritize technology investments where they’ll deliver maximum return.
When implementing operations flow charts, you should recognize their versatility across industries. Manufacturing operations use them to standardize production lines, while financial institutions employ them for compliance processes. Healthcare organizations implement them for patient journeys, and IT departments use them for disaster recovery planning.
The operations flow chart becomes particularly valuable during periods of organizational change. As you introduce new systems or restructure departments, these visual tools help maintain operational continuity by clearly communicating modified processes to all stakeholders. They’re essential for strategic planning and analysis efforts aimed at optimizing organizational performance.