Understanding Project Schedules in Excel
Creating a project schedule using Excel gives project managers an accessible, powerful tool for organizing tasks and timelines. Excel’s familiar interface paired with its calculation capabilities makes it perfect for developing comprehensive project schedules that track everything from simple task lists to complex multi-phase initiatives.
How Excel Project Schedules Drive Business Success
Project schedules using Excel function as essential business tools that improve project visibility and accountability across organizations. By centralizing timeline information in a customizable format, companies can better allocate resources, spot potential bottlenecks early, and maintain project momentum even with tight deadlines. This approach helps teams communicate progress effectively to stakeholders, ensuring everyone from executives to team members shares a clear understanding of project status and expected deliverables.
Excel project schedules offer flexibility that specialized project management software sometimes lacks. You’ll find that Excel project schedules can be quickly adapted to different business needs without extensive training or expensive licensing. The familiar spreadsheet environment makes it easier for team members to engage with the schedule directly, fostering greater participation in the planning process.
When you build a project schedule using Excel, you’re creating more than just a timeline – you’re developing a dynamic tool that can track dependencies, calculate critical paths, and highlight resource conflicts. This comprehensive view helps you make informed decisions about project priorities and resource allocation, keeping your projects on track and within budget.
Creating a Project Schedule Using Excel
Creating a project schedule using Excel transforms your project management approach into a streamlined process without expensive specialized software. Excel provides powerful features that help you organize tasks, visualize timelines, and track progress effectively. You’ll find that with the right structure and formatting techniques, you can build a comprehensive schedule that keeps your project on track from start to completion.
Customizing Your Schedule
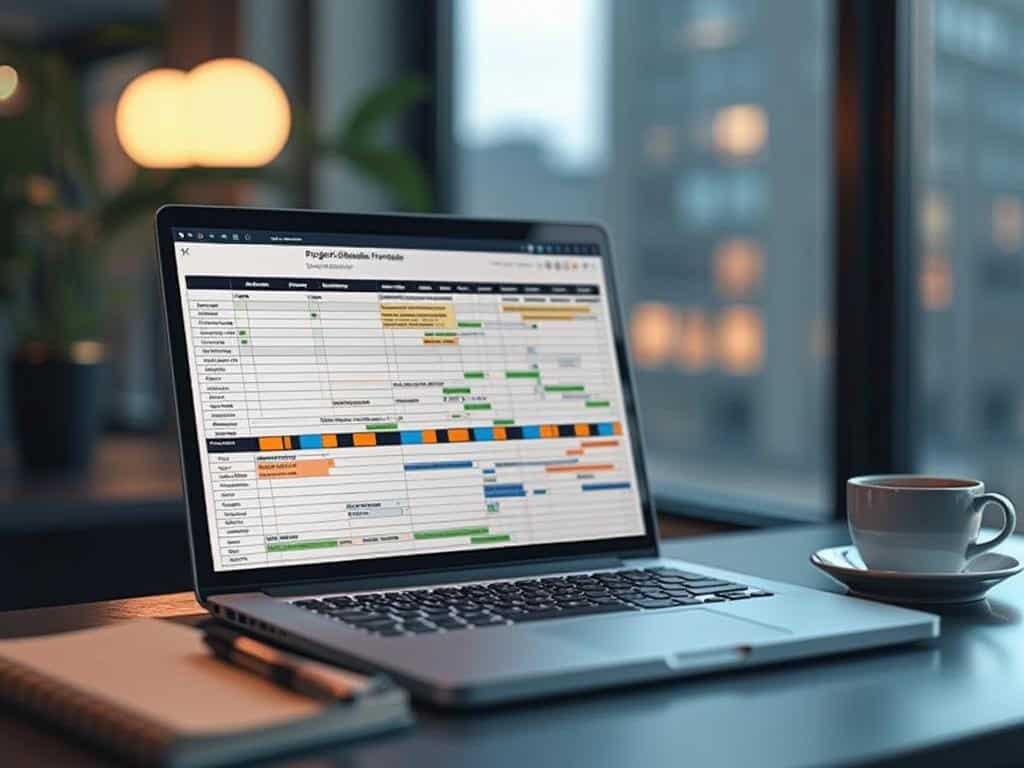
Excel’s versatility allows you to customize your project schedule with essential elements like task lists, duration calculations, and visual Gantt charts. You can enhance your schedule with color-coding, conditional formatting, and milestone markers to improve clarity. These features convert a basic spreadsheet into an effective project management tool using Excel that highlights upcoming deadlines and potential delays.
Creating an Effective Schedule
By following a few simple steps, you’ll create an effective project schedule that maintains logical task sequences while giving you a clear visual representation of your timeline. The process is straightforward and will save you time while increasing your productivity throughout the project lifecycle.
1. Set Up Your Task List
When creating a project schedule using Excel, start by establishing a solid foundation with a well-structured task list. Set up your spreadsheet with essential column headers including Task Name, Start Date, End Date, and Duration. Enter all your project tasks in chronological order to maintain a clear sequence of activities. This organizational approach helps you visualize the complete project timeline from initiation to completion.
Include task dependencies to show relationships between activities that affect your project schedule using Excel. For instance, some tasks cannot begin until others are completed, which is crucial for accurate timeline planning. Don’t forget to mark important project milestones that indicate significant achievements or decision points.
Consider these elements for your task list:
- Task ID numbers for easy reference
- Task owner assignments
- Priority levels
- Notes for special instructions
- Percentage complete column
When building your task list, ensure it aligns with your project scope baseline to prevent scope creep and maintain focus on deliverables that contribute to project success.
2. Add Project Timeline Details
When building your project schedule using Excel, timeline details form the foundation of your tracking system. Begin by inputting accurate start and end dates for each task in your spreadsheet. Use consistent date formatting (like MM/DD/YYYY) to ensure proper sorting and calculations throughout your project lifecycle.
Set up automatic duration calculations with simple Excel formulas. The basic formula =EndDate-StartDate instantly calculates task duration in days. For workdays only, use the NETWORKDAYS function to exclude weekends from your calculations.
Add these essential columns to enhance your project schedule:
- Status column (Not Started, In Progress, Completed, Delayed)
- Completion percentage (0-100%)
- Assigned resources
- Priority level
Create effective project timelines by including conditional formatting to highlight tasks that are behind schedule. This visual aid helps you quickly identify issues during project reviews. Remember to include buffer time for complex tasks to accommodate unexpected delays and prevent schedule variance.
Expert Insight: To build a robust project timeline in Excel, input accurate start and end dates while using consistent formatting. Incorporate automatic duration calculations, essential columns like status and completion percentage, and apply conditional formatting to quickly identify delayed tasks. Always include buffer time to manage unforeseen challenges effectively.
3. Create the Gantt Chart
When building a project schedule using Excel, creating a Gantt chart is essential for visualizing your timeline. Start by inserting a stacked bar chart – select your task names and timeline data, then navigate to the Insert tab and choose the appropriate chart type. The stacked bar option works best for representing task durations in your project schedule.
Format the bars to properly display each task’s duration by adjusting the fill colors and removing any unnecessary chart elements. You’ll want to customize the horizontal axis to reflect your project timeline accurately. Right-click the axis and select “Format Axis” to adjust the scale and date display options to match your project scope.
Consider these formatting tips for an effective Gantt chart:
- Use distinct colors for different task categories
- Adjust bar transparency to show overlapping tasks
- Add data labels to display key information
- Remove gridlines that don’t add value
- Align the chart with your project milestones for better tracking
Expert Insight: To create an effective Gantt chart in Excel, start with a stacked bar chart for task durations, then customize the horizontal axis to accurately reflect your timeline. Use distinct colors for task categories and adjust bar transparency to depict overlaps clearly. Align the chart with project milestones for optimal tracking.
4. Format for Clarity
Visual organization is crucial when creating a project schedule using Excel. Color-coding tasks by status or department helps you identify different project components at a glance, making your schedule instantly more navigable. Adding gridlines improves readability by creating clear separation between cells, allowing you to process information more efficiently.
When working with dates in your project schedule, proper alignment ensures consistency and professionalism. Right-align your dates while keeping text left-aligned for optimal scanning. Don’t forget to include a today’s date marker—this creates a visual reference point that helps track progress against your timeline.
For the best viewing experience, resize your columns and rows to fit your data perfectly. Columns should be wide enough to display full text without truncation, while rows should maintain consistent height unless you’re highlighting important communications or milestones.
Consider these formatting enhancements:
- Use conditional formatting to highlight overdue tasks
- Apply alternate row shading for easier tracking across columns
- Create a legend explaining your color-coding system
- Use consistent font styles for different information types
Expert Insight: Ensure clarity in your project schedule by color-coding tasks and using gridlines for readability. Align dates right and keep text left for consistency, while resizing columns and rows to fit your data. Incorporate conditional formatting and a legend for effective tracking and understanding.
5. Add Project Management Features
Enhancing your project schedule using Excel requires strategic implementation of advanced features that transform a basic timeline into a comprehensive project management tool. Conditional formatting allows you to create visual alerts for approaching deadlines—simply select your date columns, click Conditional Formatting, and set rules that highlight tasks in yellow when they’re within a week of deadline and red when overdue.
Milestone markers provide critical checkpoints in your project schedule. Create these by adding a special column labeled “Milestone” with a simple Yes/No dropdown, then use shape symbols (⬥) to visually represent these important points on your Gantt chart.
Resource allocation becomes manageable with these Excel features:
- Create a dedicated resources column listing team members
- Add capacity planning columns showing hours or percentage allocation
- Use data validation to prevent overallocation of resources
Progress tracking requires smart formulas that calculate real-time status:
- Insert a % Complete column using simple numerical values
- Add SUM formulas to create a dashboard showing overall completion
- Use IF statements to flag tasks that are behind schedule
Linking dependent tasks through project dependencies helps identify potential bottlenecks. Utilize Excel’s “Predecessor” column to specify which tasks must be completed before others can begin, ensuring your project schedule maintains logical sequence and timing.
Expert Insight: To enhance your Excel project schedule, use conditional formatting for deadline alerts, implement milestone markers for critical checkpoints, and manage resource allocation with dedicated columns and data validation. Additionally, track progress with smart formulas and link dependent tasks to identify bottlenecks, ensuring a logical project flow.
Creating a project schedule using Excel provides a powerful yet accessible way to organize, visualize, and track project tasks through a structured framework of timelines, dependencies, and visual elements. By leveraging Excel’s built-in features like conditional formatting, formulas, and chart capabilities, you can transform a simple spreadsheet into a comprehensive project management tool that helps ensure timely delivery of project objectives.
Project schedules in Excel are essential for business users who need cost-effective project management solutions without specialized software investments. Organizations benefit from Excel’s universal availability, familiar interface, and flexibility in customizing schedules to specific business requirements, while enabling real-time progress tracking, resource allocation management, and visual reporting capabilities that help teams stay aligned and accountable throughout the project lifecycle.
Mastering Excel Project Scheduling: Key Takeaways
Creating effective project schedules in Excel combines strategic organization with visual clarity to deliver powerful project management capabilities. By following the five-step approach—setting up structured task lists, adding detailed timeline information, creating visual Gantt charts, formatting for clarity, and implementing advanced project management features—you can transform a standard spreadsheet into a comprehensive project control center. Excel’s flexibility allows teams to track dependencies, highlight milestones, manage resources, and monitor progress without specialized software, making it an accessible yet powerful tool for projects of any size.
| Project Schedule Element | Key Excel Features | Benefits |
|---|---|---|
| Task List | Column headers, ID numbers, owners | Organizational clarity |
| Timeline Details | Date formatting, NETWORKDAYS function | Accurate duration tracking |
| Gantt Chart | Stacked bar charts, axis customization | Visual timeline representation |
| Formatting | Color-coding, conditional formatting | At-a-glance status identification |
| PM Features | Milestone markers, resource allocation | Comprehensive project control |
Implementing Your Excel Project Schedule
- Set up a structured task list with essential columns (Task Name, Start/End Dates, Duration)
- Create consistent date formatting and implement automatic duration calculations
- Build a visual Gantt chart using stacked bar charts with customized formatting
- Apply color-coding and conditional formatting to highlight task status
- Add milestone markers for significant project checkpoints
- Implement resource allocation columns to track team assignments
- Use data validation to prevent resource overallocation
- Create progress tracking formulas to calculate completion percentages
- Link dependent tasks to identify potential bottlenecks
- Establish a system for regular updates and maintenance of the schedule
Frequently Asked Questions
How do I calculate task durations automatically in Excel?
Use the formula =EndDate-StartDate for basic duration in days, or use the NETWORKDAYS function (=NETWORKDAYS(StartDate,EndDate)) to calculate only working days by excluding weekends.
Can I create a Gantt chart in Excel without add-ins?
Yes, you can create a Gantt chart using Excel’s built-in stacked bar chart feature. Select your task names and timeline data, navigate to the Insert tab, choose a stacked bar chart, and then customize it to display your project timeline.
How do I highlight overdue tasks in my Excel project schedule?
Use conditional formatting by selecting your date columns, clicking on Conditional Formatting in the Home tab, and setting rules to highlight tasks that are past their due dates with red formatting.
What’s the best way to show dependencies between tasks?
Create a “Predecessor” column in your spreadsheet where you can list the Task IDs of activities that must be completed before the current task can begin. This creates a clear reference for task dependencies.
How can I track resource allocation in my Excel project schedule?
Add a dedicated resources column listing team members and create additional columns showing hours or percentage allocation. Use data validation to prevent overallocation and SUM functions to calculate total allocation per resource.
Is Excel suitable for large, complex projects?
While Excel works well for small to medium projects, very large or complex projects with hundreds of tasks or extensive dependencies might benefit from dedicated project management software. However, Excel can handle surprisingly complex projects with proper structure and formulas.


