A Risk Assessment Matrix Example
A risk assessment matrix example functions as a visual tool that helps organizations evaluate and prioritize potential risks by plotting them on a grid based on their likelihood and impact. This framework allows decision-makers to assess threats systematically across different dimensions, using a standardized 5×5 structure that calculates risk scores by multiplying probability and consequence ratings.
Key Takeaways:
- Provides a structured approach to identifying, analyzing, and prioritizing organizational risks
- Uses a color-coded matrix with scores ranging from low (1-4) to high (15-25) risk levels
- Enables quick visual communication of risk severity and potential organizational impact
- Supports data-driven strategic planning and resource allocation
- Facilitates proactive risk management through systematic threat evaluation
The value of risk matrices lies in their simplicity and effectiveness. By using risk assessment tools, you can transform complex threat information into actionable insights. These visual representations help stakeholders quickly understand which risks require immediate attention versus those that can be monitored with less urgency.
Creating an effective matrix starts with determining the specific factors relevant to your organization. Consider industry standards, regulatory requirements, and your company’s risk tolerance when establishing your rating scales. This customization ensures the matrix accurately reflects your specific operational concerns.
Risk scores generated through the matrix guide resource allocation decisions. High-risk items (typically marked red on the matrix) demand prompt attention and substantial resources, while lower-risk items (often green) might need only basic monitoring. This prioritization creates a clear roadmap for your risk management strategy.
Regular reviews of your risk assessment matrix keep it relevant. As your business environment changes, new risks emerge while others become less significant. Setting up quarterly or semi-annual reviews ensures your risk management practices remain aligned with current business conditions.
The practical application extends beyond theoretical assessment. Many organizations integrate their matrices with incident reporting systems, creating a dynamic feedback loop that improves accuracy over time. This integration transforms the matrix from a static document into a living tool that captures evolving threat landscapes.
Training staff to understand and contribute to the risk assessment process amplifies its effectiveness. When employees across departments can identify and report potential risks using a standardized framework, your organization benefits from broader threat detection capabilities and develops a more robust risk management culture.
“A risk assessment matrix transforms chaos into clarity, allowing organizations to visualize and prioritize potential threats with precision. By leveraging a structured, color-coded grid, decision-makers can navigate complexities and allocate resources strategically, paving the way for proactive risk management and informed strategic planning.”
Core Components of a Risk Assessment Matrix
A risk assessment matrix example serves as a powerful visual tool that helps you evaluate and prioritize potential risks facing your organization. This strategic framework consists of several essential elements that work together to create a comprehensive risk management system.
The matrix is built on two primary axes: likelihood and impact. You’ll typically find these organized on a scale ranging from negligible to severe for impact, and from highly unlikely to highly likely for probability. By assigning numerical values to each level, you can calculate risk scores by multiplying the likelihood score by the impact score.
These scores then fall into distinct risk categorization ranges:
- Low Risk (scores 1-4): Minimal threat requiring standard monitoring
- Medium Risk (scores 5-14): Moderate concerns needing regular attention
- High Risk (scores 15-25): Critical issues demanding immediate action plans
Matrix Design and Visualization
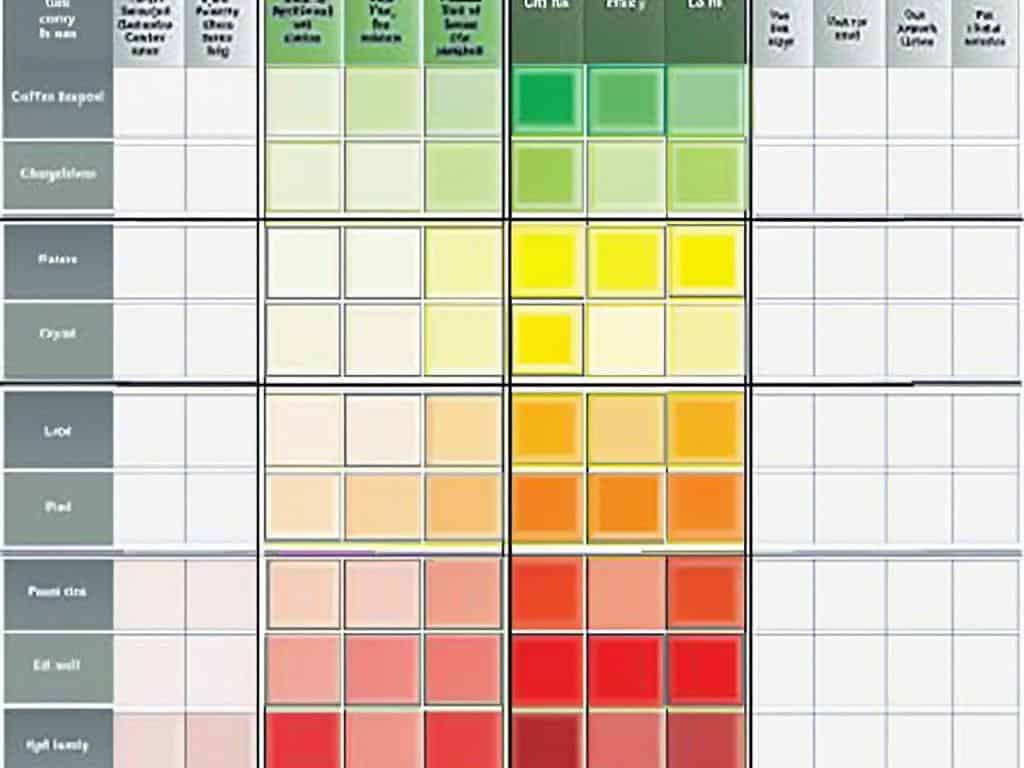
The most common risk assessment matrix example uses a 5×5 structure, creating 25 possible risk positions. Color-coding enhances visual clarity and allows for quick interpretation:
| Likelihood/Impact | Negligible (1) | Minor (2) | Moderate (3) | Major (4) | Severe (5) |
|---|---|---|---|---|---|
| Highly Likely (5) | 5 (Medium) | 10 (Medium) | 15 (High) | 20 (High) | 25 (High) |
| Likely (4) | 4 (Low) | 8 (Medium) | 12 (Medium) | 16 (High) | 20 (High) |
| Possible (3) | 3 (Low) | 6 (Medium) | 9 (Medium) | 12 (Medium) | 15 (High) |
| Unlikely (2) | 2 (Low) | 4 (Low) | 6 (Medium) | 8 (Medium) | 10 (Medium) |
| Highly Unlikely (1) | 1 (Low) | 2 (Low) | 3 (Low) | 4 (Low) | 5 (Medium) |
This risk assessment matrix example provides you with a systematic approach to effective risk response planning by clearly showing which risks require immediate attention and which can be monitored periodically. The visual representation makes complex risk assessments accessible to all stakeholders and supports risk response strategies development.
When implementing a risk assessment matrix, you’ll find it benefits your organization through enhanced decision-making capabilities and more efficient resource allocation. The structured approach helps you develop proactive risk mitigation plans rather than reacting to issues as they arise. Understanding the difference between risk appetite vs risk tolerance will further enhance your matrix’s effectiveness.
To maximize the value of your risk assessment matrix example, conduct comprehensive qualitative risk assessment with key stakeholders, reviewing and updating your matrix at least annually to reflect your evolving risk landscape.
Organizations that effectively manage risk can achieve up to 28% higher earnings than their competitors.
forbes.com
Risk Identification and Analysis Process
Developing an effective risk assessment matrix example starts with thorough risk identification. You’ll need to explore your organization’s complete risk landscape across operational, financial, strategic, and compliance domains. This process helps you plan effective risk responses that protect your business.
The risk assessment matrix example should begin with comprehensive stakeholder input. Gather your team leaders, subject matter experts, and key decision-makers for structured brainstorming sessions. During these meetings, encourage participants to identify potential risks using these approaches:
- Historical review of past incidents and near-misses
- External scanning for industry-specific threats
- Internal assessment of process vulnerabilities
- Regulatory review to identify compliance requirements
- Technology evaluation for digital risks
Once you’ve identified risks, the next step in your risk assessment matrix example is analysis. You’ll need to evaluate each risk using both quantitative and qualitative methods. Quantitative assessment assigns numerical values to likelihood and impact, while qualitative assessment captures contextual factors that numbers alone might miss.
Risk Assessment Matrix Example Components
Your risk assessment matrix example should include clear categorization of risk types. This helps ensure comprehensive risk assessment and appropriate response planning. A well-structured matrix typically includes:
| Risk Type | Definition | Example in Matrix |
|---|---|---|
| Operational | Risks affecting day-to-day activities | Production line failure (3×4=12, Medium) |
| Financial | Monetary and resource-related risks | Cash flow shortage (4×5=20, High) |
| Strategic | Risks impacting long-term objectives | Market disruption (2×5=10, Medium) |
| Compliance | Regulatory and legal requirement risks | Data breach (3×5=15, High) |
The analysis phase demands rigorous examination of each identified risk. You’ll need to determine both probability and potential impact scores. Most risk assessment matrix examples use a 1-5 scale for each dimension, creating a 5×5 grid with 25 possible positions. This approach creates a standardized framework for evaluating disparate risks.
Your risk assessment matrix example should include clear guidance for scoring consistency. Define what each level means within your organizational context. For instance, a financial impact of level 3 might represent losses between $100,000-$500,000, while a probability score of 4 might indicate a 60-80% likelihood of occurrence.
The risk assessment matrix example provides the foundation for operational risk management strategies. By multiplying probability and impact scores, you’ll generate risk priority scores that guide resource allocation and mitigation planning. Remember to update your matrix regularly as new risks emerge and existing threats evolve.
Expert Insight: To effectively identify and analyze risks within your organization, begin by engaging stakeholders through structured brainstorming sessions that leverage diverse perspectives. Utilize both qualitative and quantitative assessment methods in your risk matrix to ensure comprehensive evaluation, accounting for contextual factors alongside numerical ratings. Regularly update your risk assessment matrix to adapt to emerging threats and changing organizational landscapes, thereby enhancing your risk management strategies.
Matrix Design and Visualization Techniques
Creating an effective risk assessment matrix example requires thoughtful design and visualization to communicate complex risk data clearly. Your matrix should serve as a strategic decision-making tool that instantly conveys risk priorities across your organization.
A standard 5×5 risk assessment matrix example provides the ideal balance between simplicity and detail. This structure allows you to plot risks according to their likelihood (probability) and potential impact (consequence). You’ll typically represent this using a color-coded system where green indicates low-risk areas (scores 1-4), yellow/orange shows moderate-risk zones (scores 5-14), and red highlights high-risk critical areas (scores 15-25).
Essential Visualization Elements
When designing your risk assessment matrix example, include these key components for maximum effectiveness:
- Clear axis labels that define both probability and impact scales
- Numbered scoring system (typically 1-5) for consistent evaluation
- Color-coding that instantly communicates risk severity
- Brief descriptions of what each severity level represents
- Risk ID numbers or codes for tracking identified risks
- Legend explaining the color scheme and scoring methodology
The visual impact of your risk assessment matrix example significantly affects how stakeholders perceive and respond to risks. A well-designed matrix helps strategic planning teams quickly identify which risks require immediate attention and which can be monitored with less urgency. This visualization becomes particularly valuable when planning effective risk responses that align with your organization’s risk tolerance.
Remember that your risk assessment matrix example should be tailored to your specific organizational needs. Some organizations benefit from additional elements like risk trend indicators or responsibility assignments directly in the matrix. The key is ensuring your matrix remains a practical tool for qualitative risk assessment rather than becoming overly complex.
By implementing a well-designed risk assessment matrix example, you’ll create a powerful communication tool that transforms abstract risk concepts into actionable insights for decision-makers across your organization.
Data visualization allows decision-makers to grasp complex information more readily, facilitating strategic planning and risk management.
hbr.org
Industry-Specific Applications
Various sectors have adapted risk assessment matrix examples to address their unique challenges. You’ll find these strategic tools deployed differently across industries, each with customized approaches that reflect sector-specific threats and opportunities.
Sector-Specific Risk Assessment Matrix Applications
In healthcare, risk assessment matrices focus heavily on patient safety, clinical outcomes, and regulatory compliance. A typical healthcare risk assessment matrix example might evaluate risks like medication errors, hospital-acquired infections, and equipment failures against both likelihood and potential patient impact. These matrices often incorporate additional dimensions for regulatory consequences and reputational damage.
Financial institutions utilize risk assessment matrix examples to evaluate credit risks, market volatility, and compliance breaches. Their matrices typically feature more granular probability scales and quantitative impact measures expressed in monetary terms. You’ll notice their risk assessment matrix examples often include specialized columns for regulatory capital requirements and liquidity impacts.
The oil and gas industry implements robust risk assessment matrices with particular emphasis on safety and environmental concerns. Their risk assessment matrix example typically includes specialized sections for evaluating potential catastrophic events against both short and long-term impacts. You’ll find effective risk response planning especially critical in this high-stakes industry.
Manufacturing operations utilize risk assessment matrix examples that prioritize supply chain disruptions, equipment failures, and quality control issues. These matrices often incorporate production downtime metrics and detailed probability calculations based on historical data. Your manufacturing risk assessment matrix example should include both immediate financial impacts and longer-term customer satisfaction effects.
Technology companies implement risk assessment matrices focused on cybersecurity threats, intellectual property risks, and rapid market changes. Their risk assessment matrix example often includes specialized ratings for data sensitivity and business continuity implications. You can improve your technology risk management through understanding risk capacity, appetite and tolerance thresholds.
Each industry customizes their risk assessment matrix example to reflect unique operational challenges. Healthcare matrices prioritize patient outcomes, while financial matrices emphasize monetary impacts. Your industry’s risk assessment matrix example should align with specific regulatory requirements and operational realities to provide meaningful decision support.
Strategic Implementation and Benefits
Implementing a risk assessment matrix example transforms your organization’s approach to threat management. Your leadership team gains a structured method to evaluate potential dangers while developing appropriate responses. The matrix serves as a visual decision-making tool that helps prioritize risks based on their likelihood and potential impact.
A well-designed risk assessment matrix provides several strategic advantages. You’ll experience enhanced decision-making capabilities as your team can quickly identify which risks demand immediate attention versus those that can be monitored. This clarity leads to more efficient strategic planning and resource allocation.
Here are the key benefits you’ll gain from implementing a risk assessment matrix:
- Improved organizational resilience through systematic risk identification
- Structured approach to risk management with clear prioritization guidelines
- Data-driven strategic planning based on quantifiable risk assessments
- Streamlined communication about risks across departments
- Enhanced stakeholder confidence through demonstrated risk awareness
Practical Implementation Approach
To maximize the effectiveness of your risk assessment matrix example, you should integrate it into your risk response planning processes. This ensures that identified risks are not only evaluated but also addressed through appropriate mitigation strategies.
| Implementation Phase | Key Activities | Expected Outcomes |
|---|---|---|
| Initial Setup | Define matrix parameters, train team members | Established risk assessment structure |
| Risk Identification | Conduct workshops, gather departmental input | Comprehensive risk inventory |
| Matrix Population | Score risks, categorize by severity | Visualized risk landscape |
| Response Development | Create mitigation plans for high-priority risks | Actionable risk management strategies |
| Monitoring & Review | Schedule regular matrix updates (minimum annually) | Dynamic risk management approach |
For optimal results, you should review and update your risk assessment matrix at least annually. This ensures your risk management approach remains responsive to changing market conditions and organizational priorities. Some organizations in volatile industries opt for quarterly reviews to maintain risk assessment matrix example accuracy and relevance.